A Brand New Dashboard
We are really happy to share what we’ve been working on recently. It’s one of our biggest updates yet. Check out the brand new Seed dashboard!
We’ve also made a few other updates to the Seed console to go with this dashboard. So let’s dive right into the changes!
Dashboard
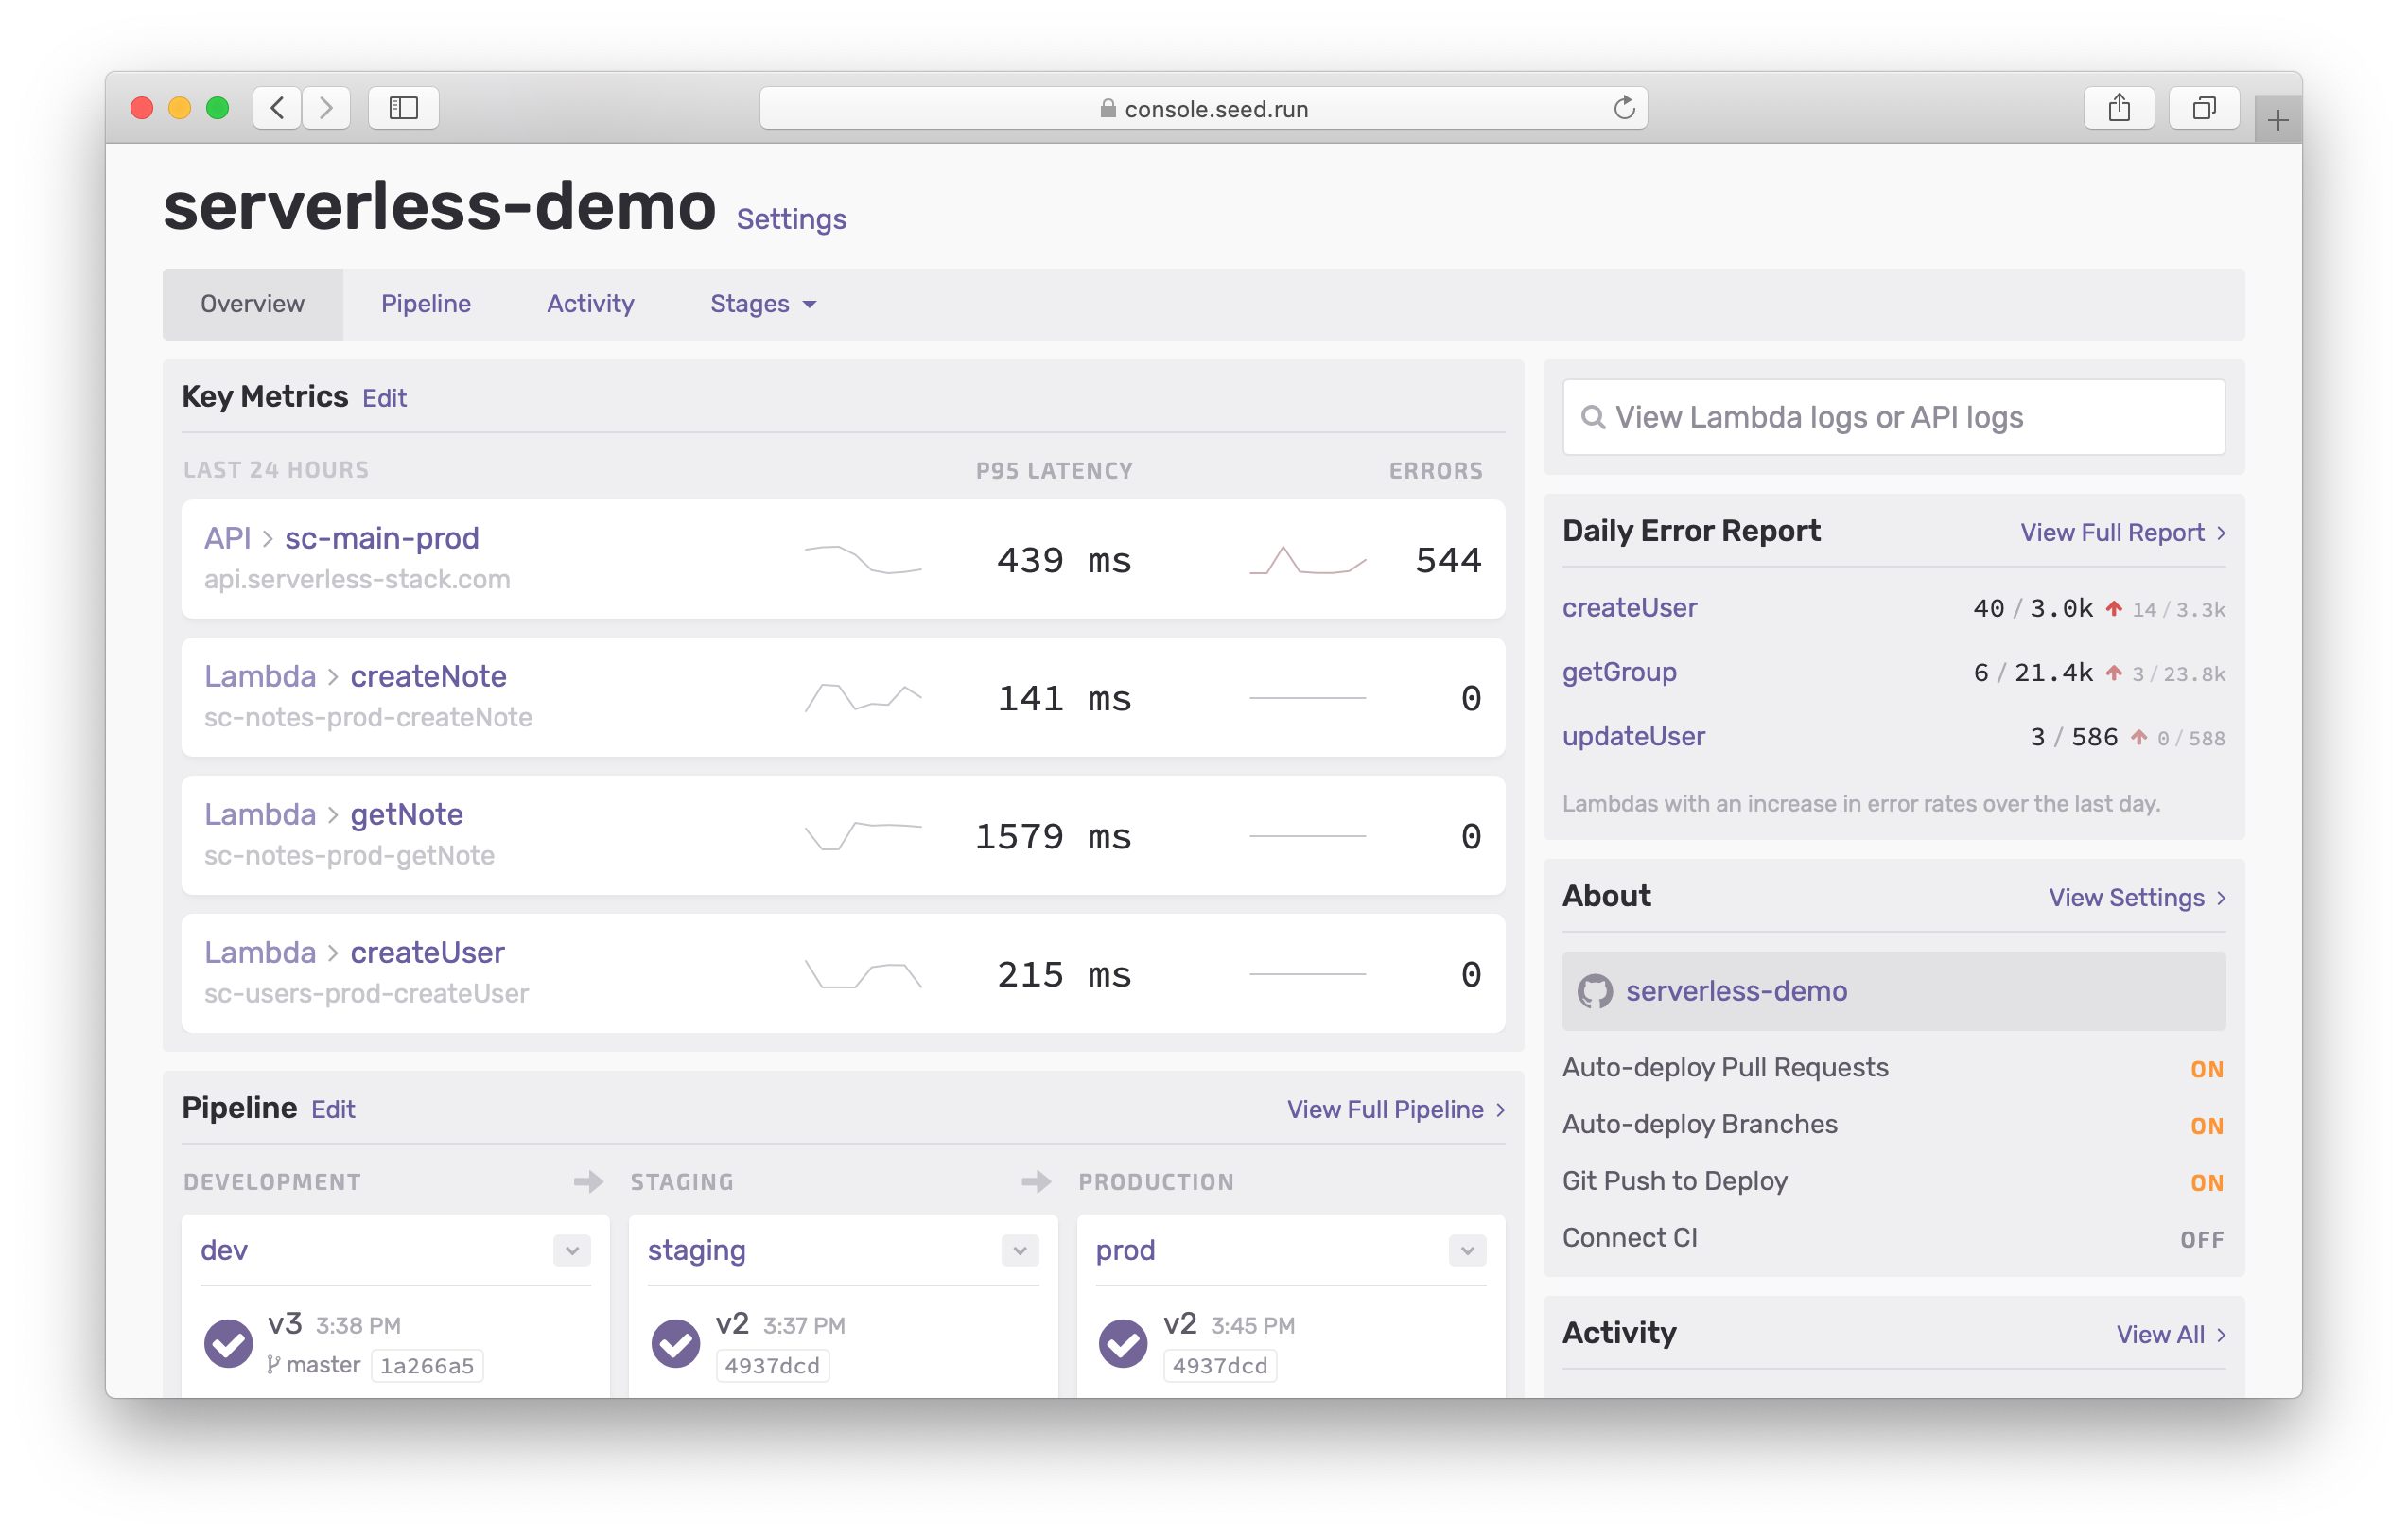
The new dashboard really brings together all of our recent updates; Logs, Metrics, and App Reports. Along with a simple and convenient view of your pipeline and the recent build activity.
Key Metrics
Front and center in the dashboard is a way for you to keep an eye on the health of your app.
This gives you a quick idea of how your app has been performing in the last 24 hours and how it compares to the last week.
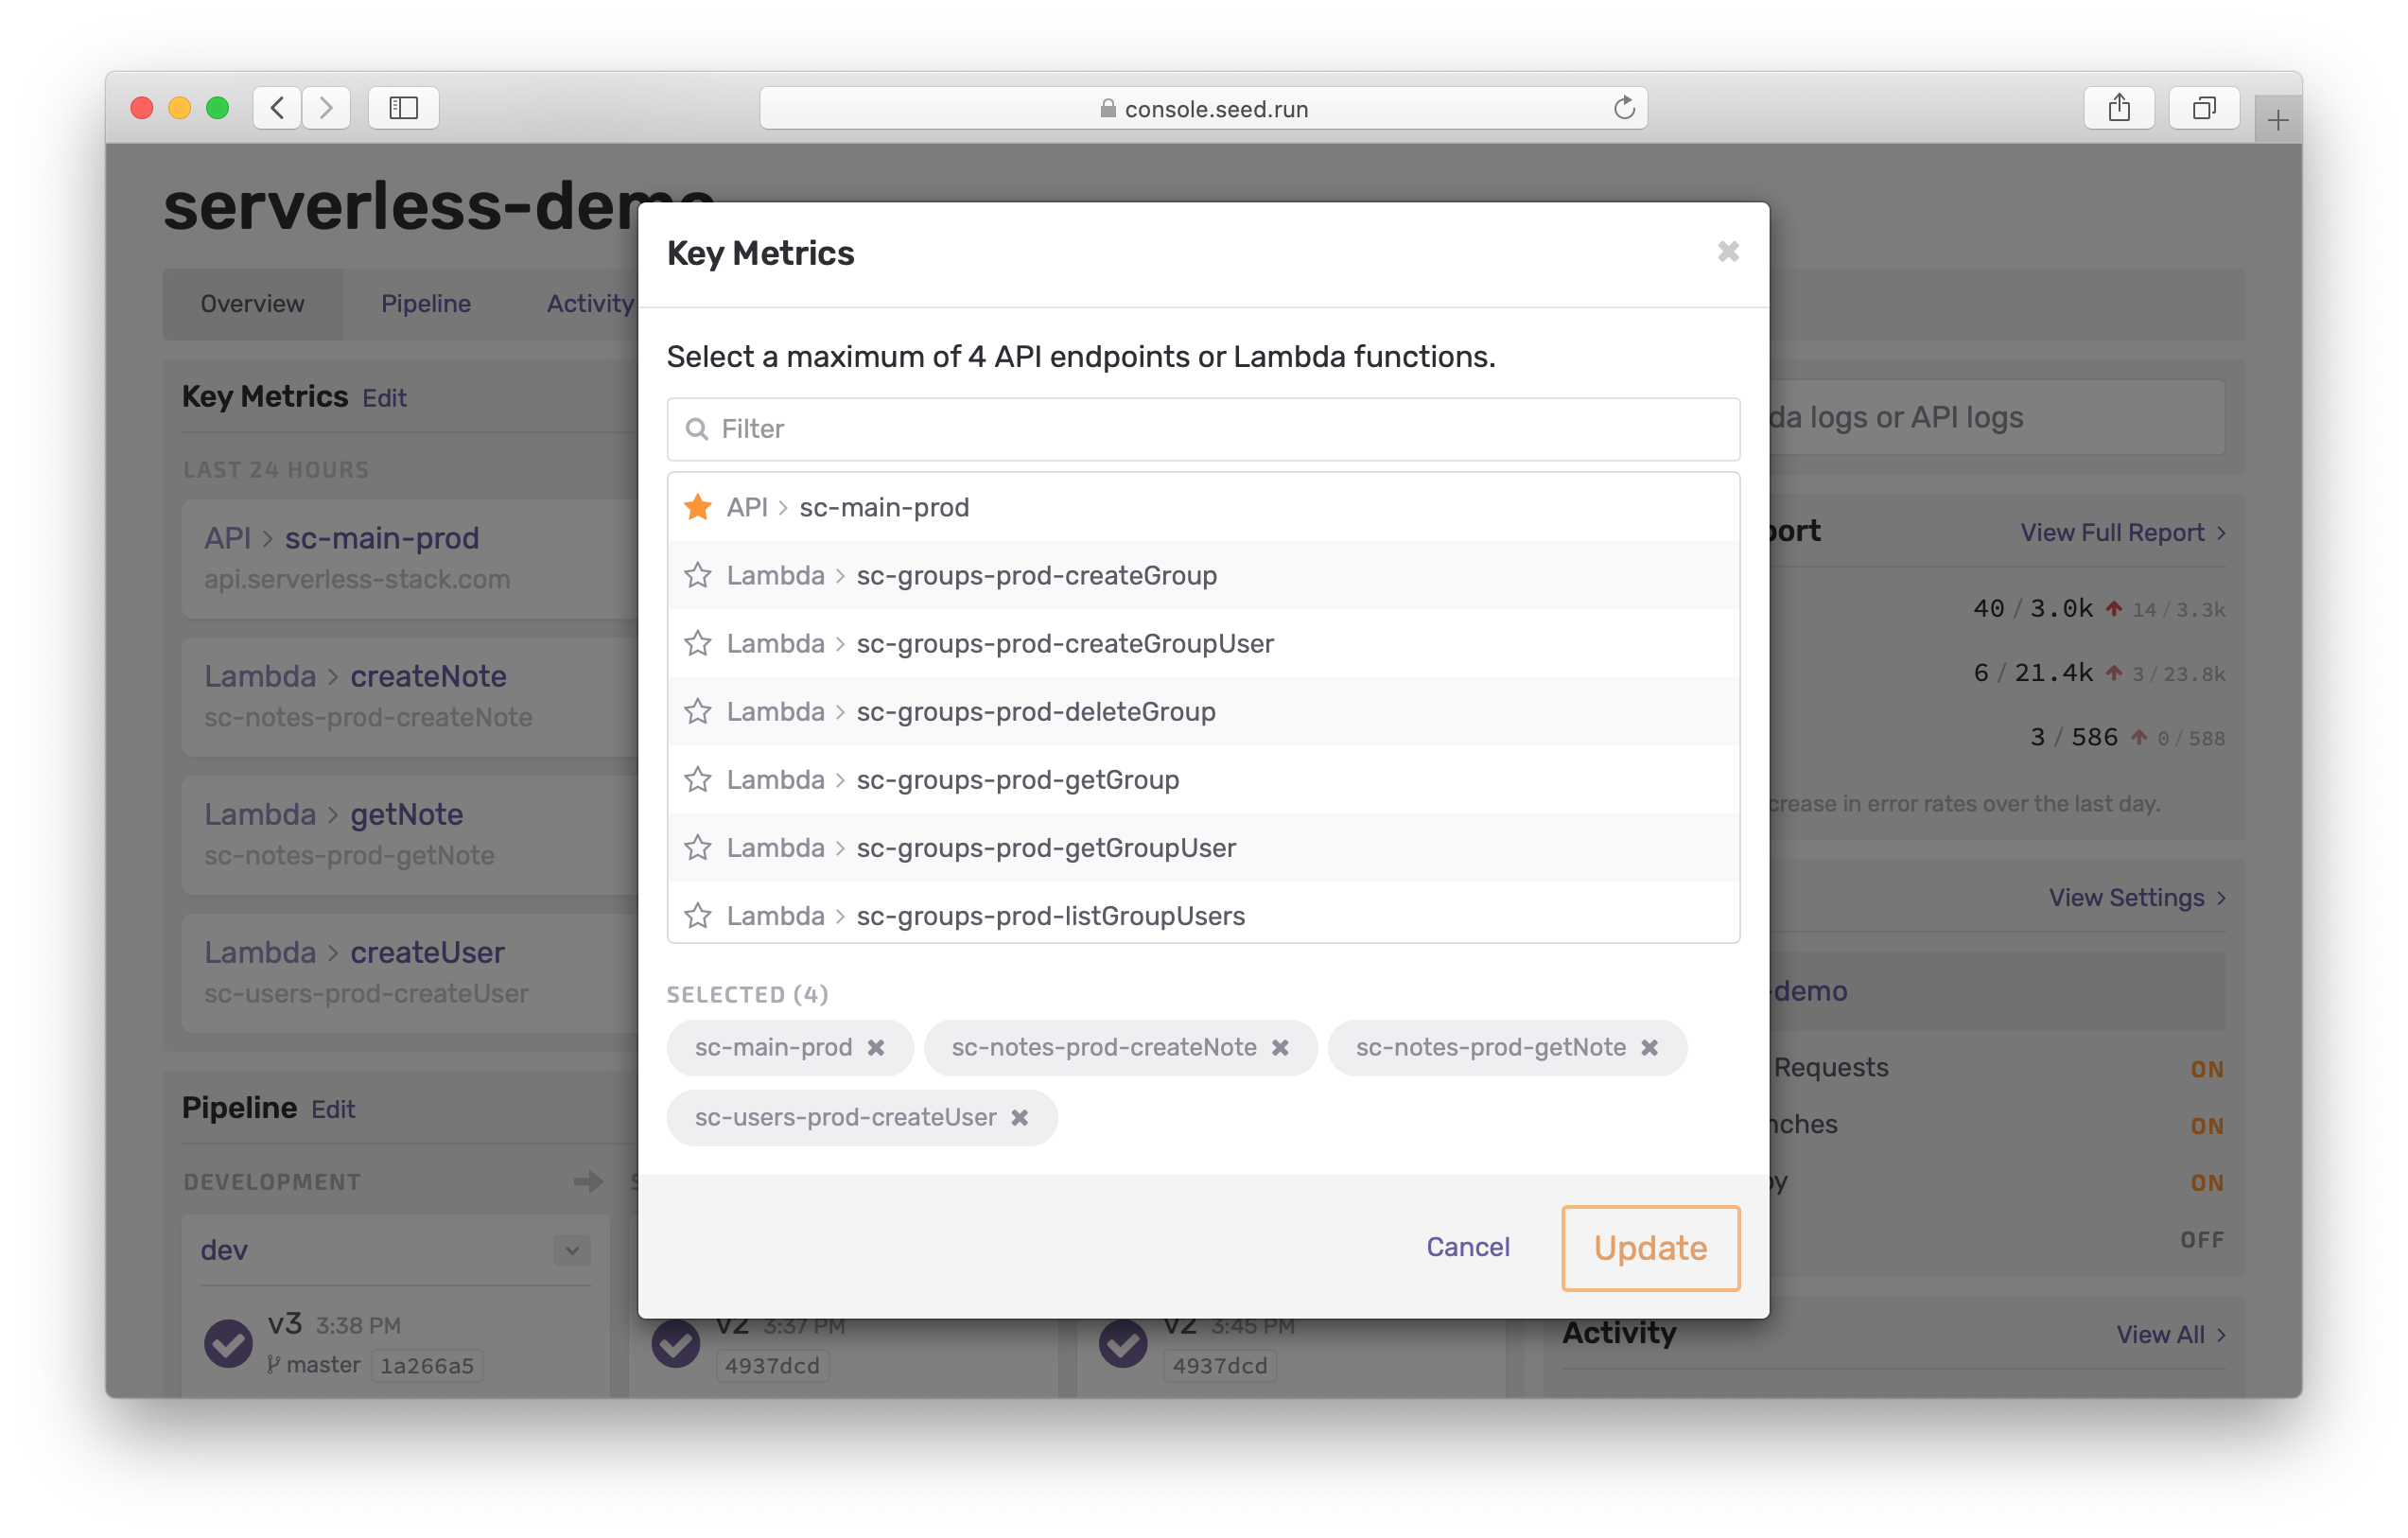
You can pick four of your app’s API endpoints or Lambda functions to display these key metrics.
Viewing Logs
The new dashboard gives you a powerful search to instantly access your Lambda and API Gateway logs.
You can search for Lambda functions and APIs across all the stages (and services) in your app. You won’t have to navigate to a specific stage to look for your logs anymore.
Lambda Error Reports
Seed generates App Reports (both daily and weekly). These reports do a great job of highlighting which of your Lambda functions have seen a rise in their error rates.
The new dashboard pulls this up for you automatically.
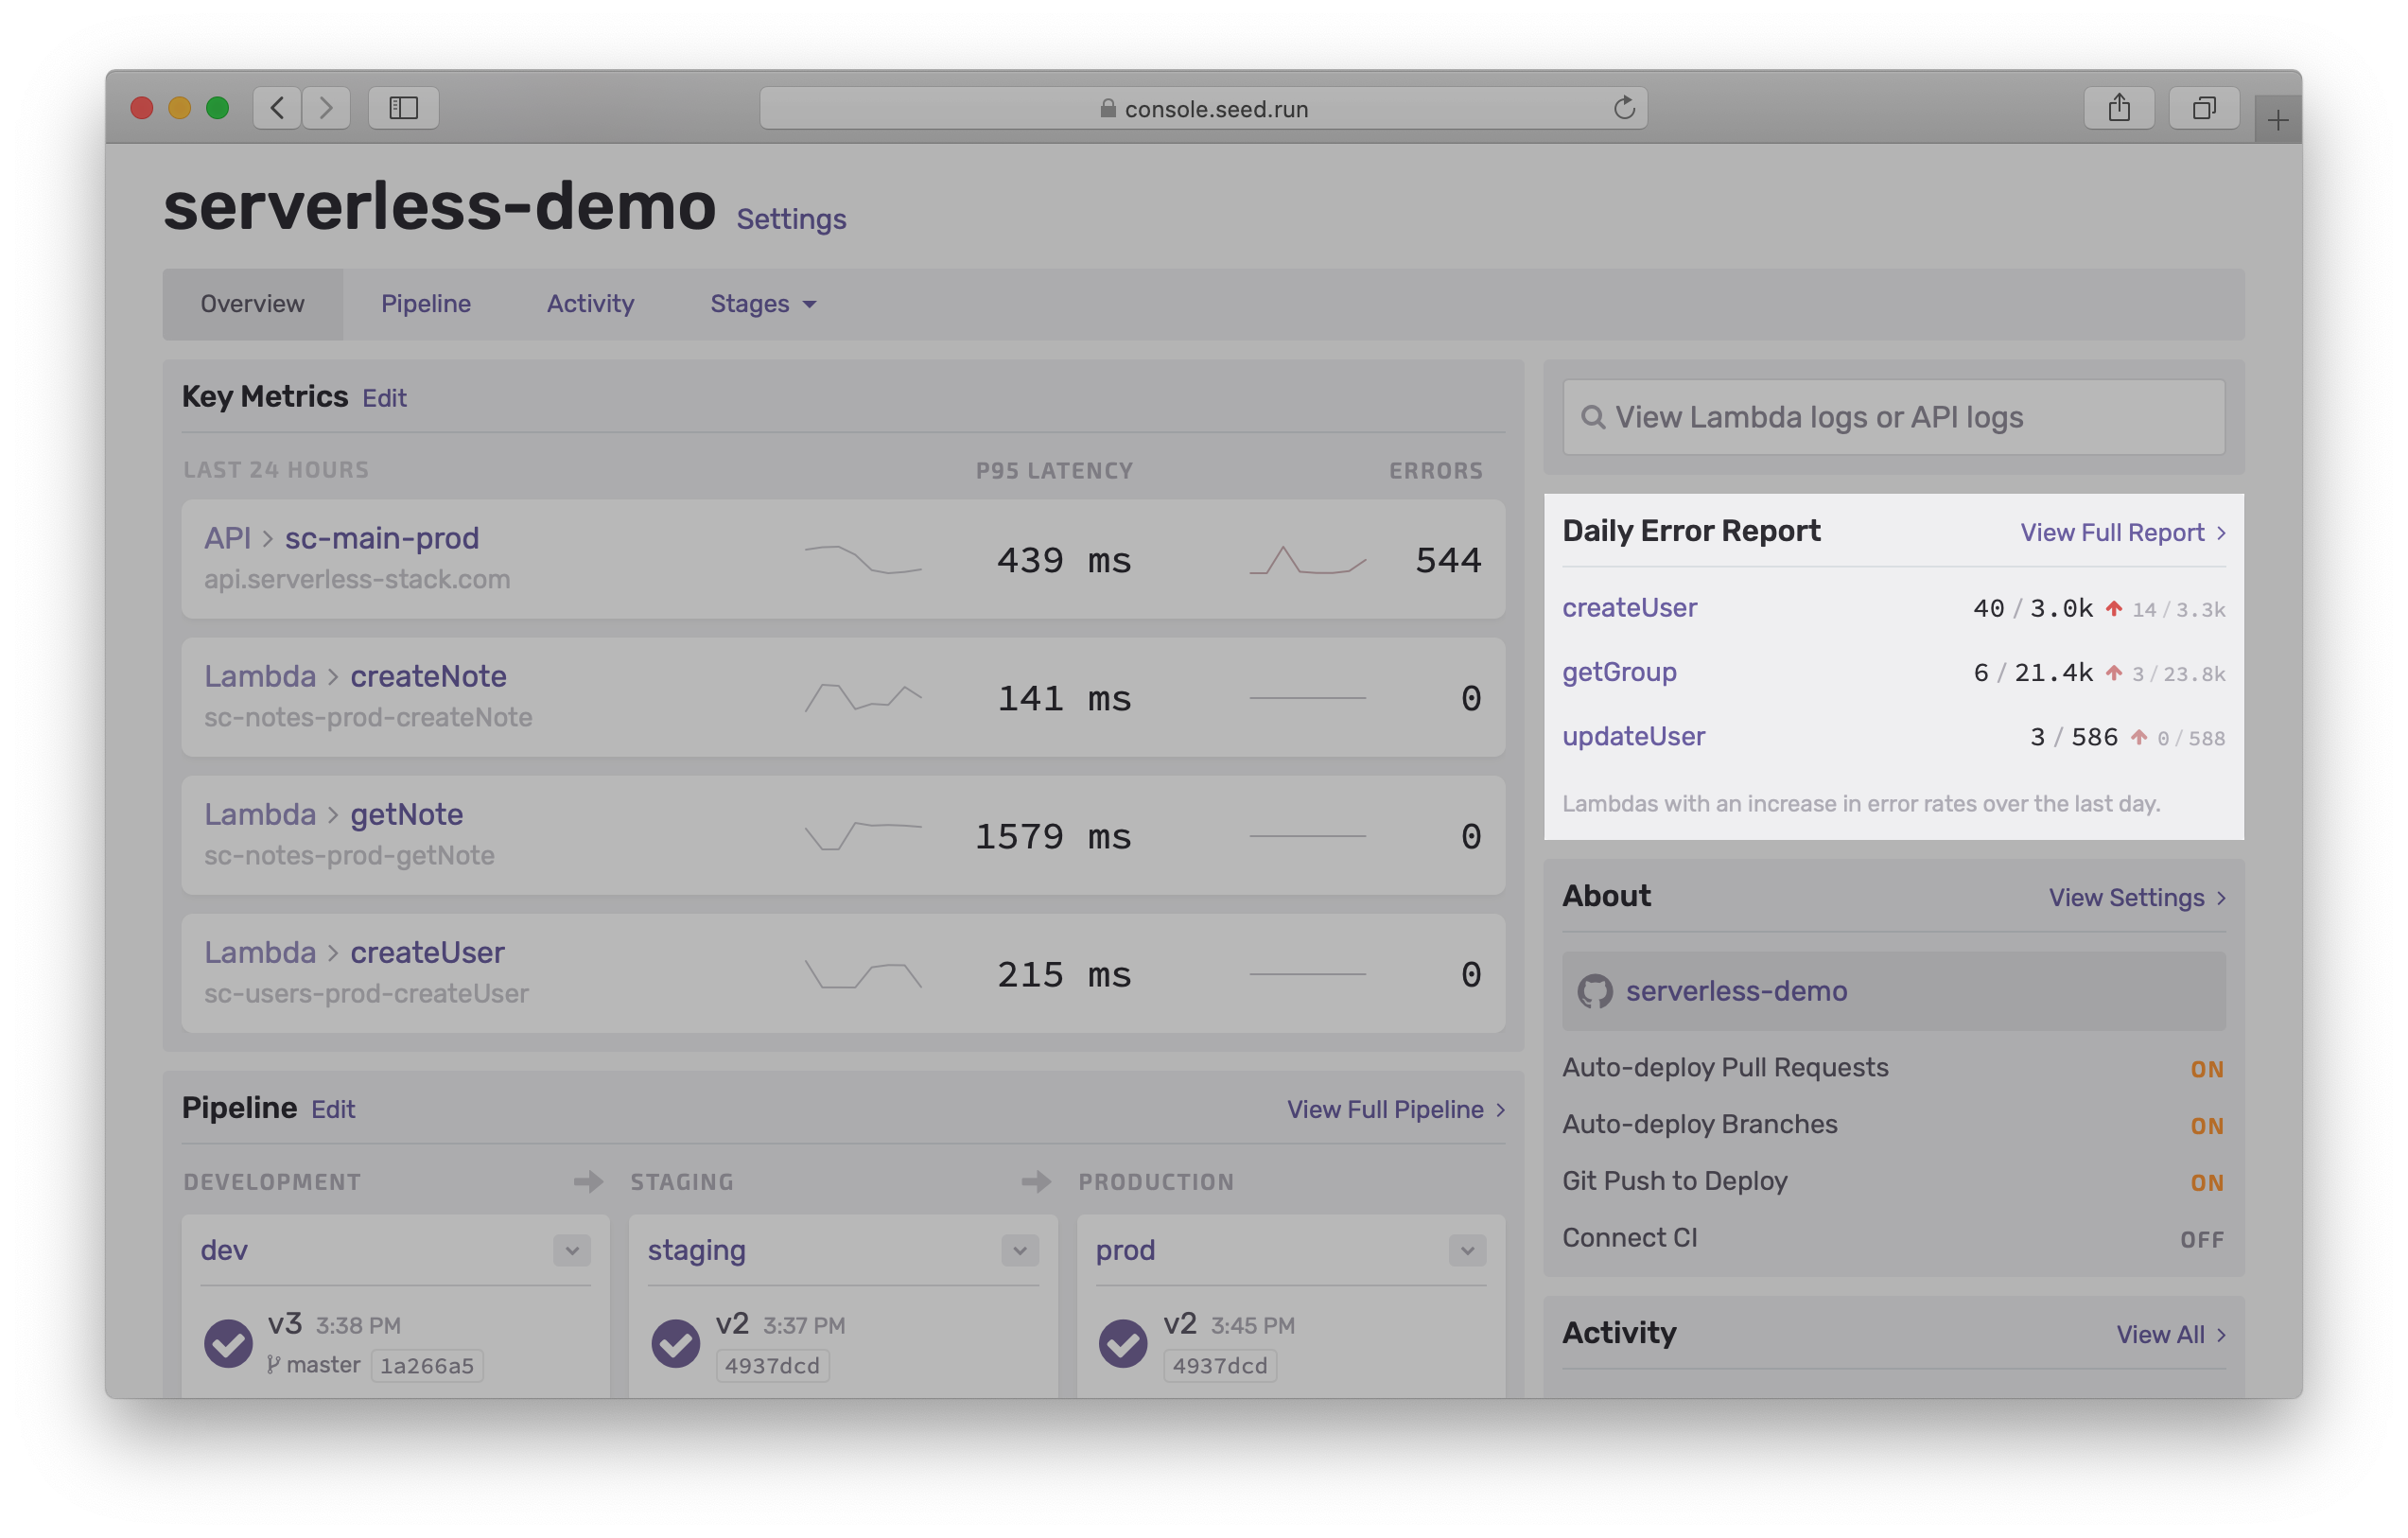
This, together with the key metrics really helps you monitor your app’s performance.
Pipeline
We’ve pulled out the key portions of the full pipeline into a new condensed view.
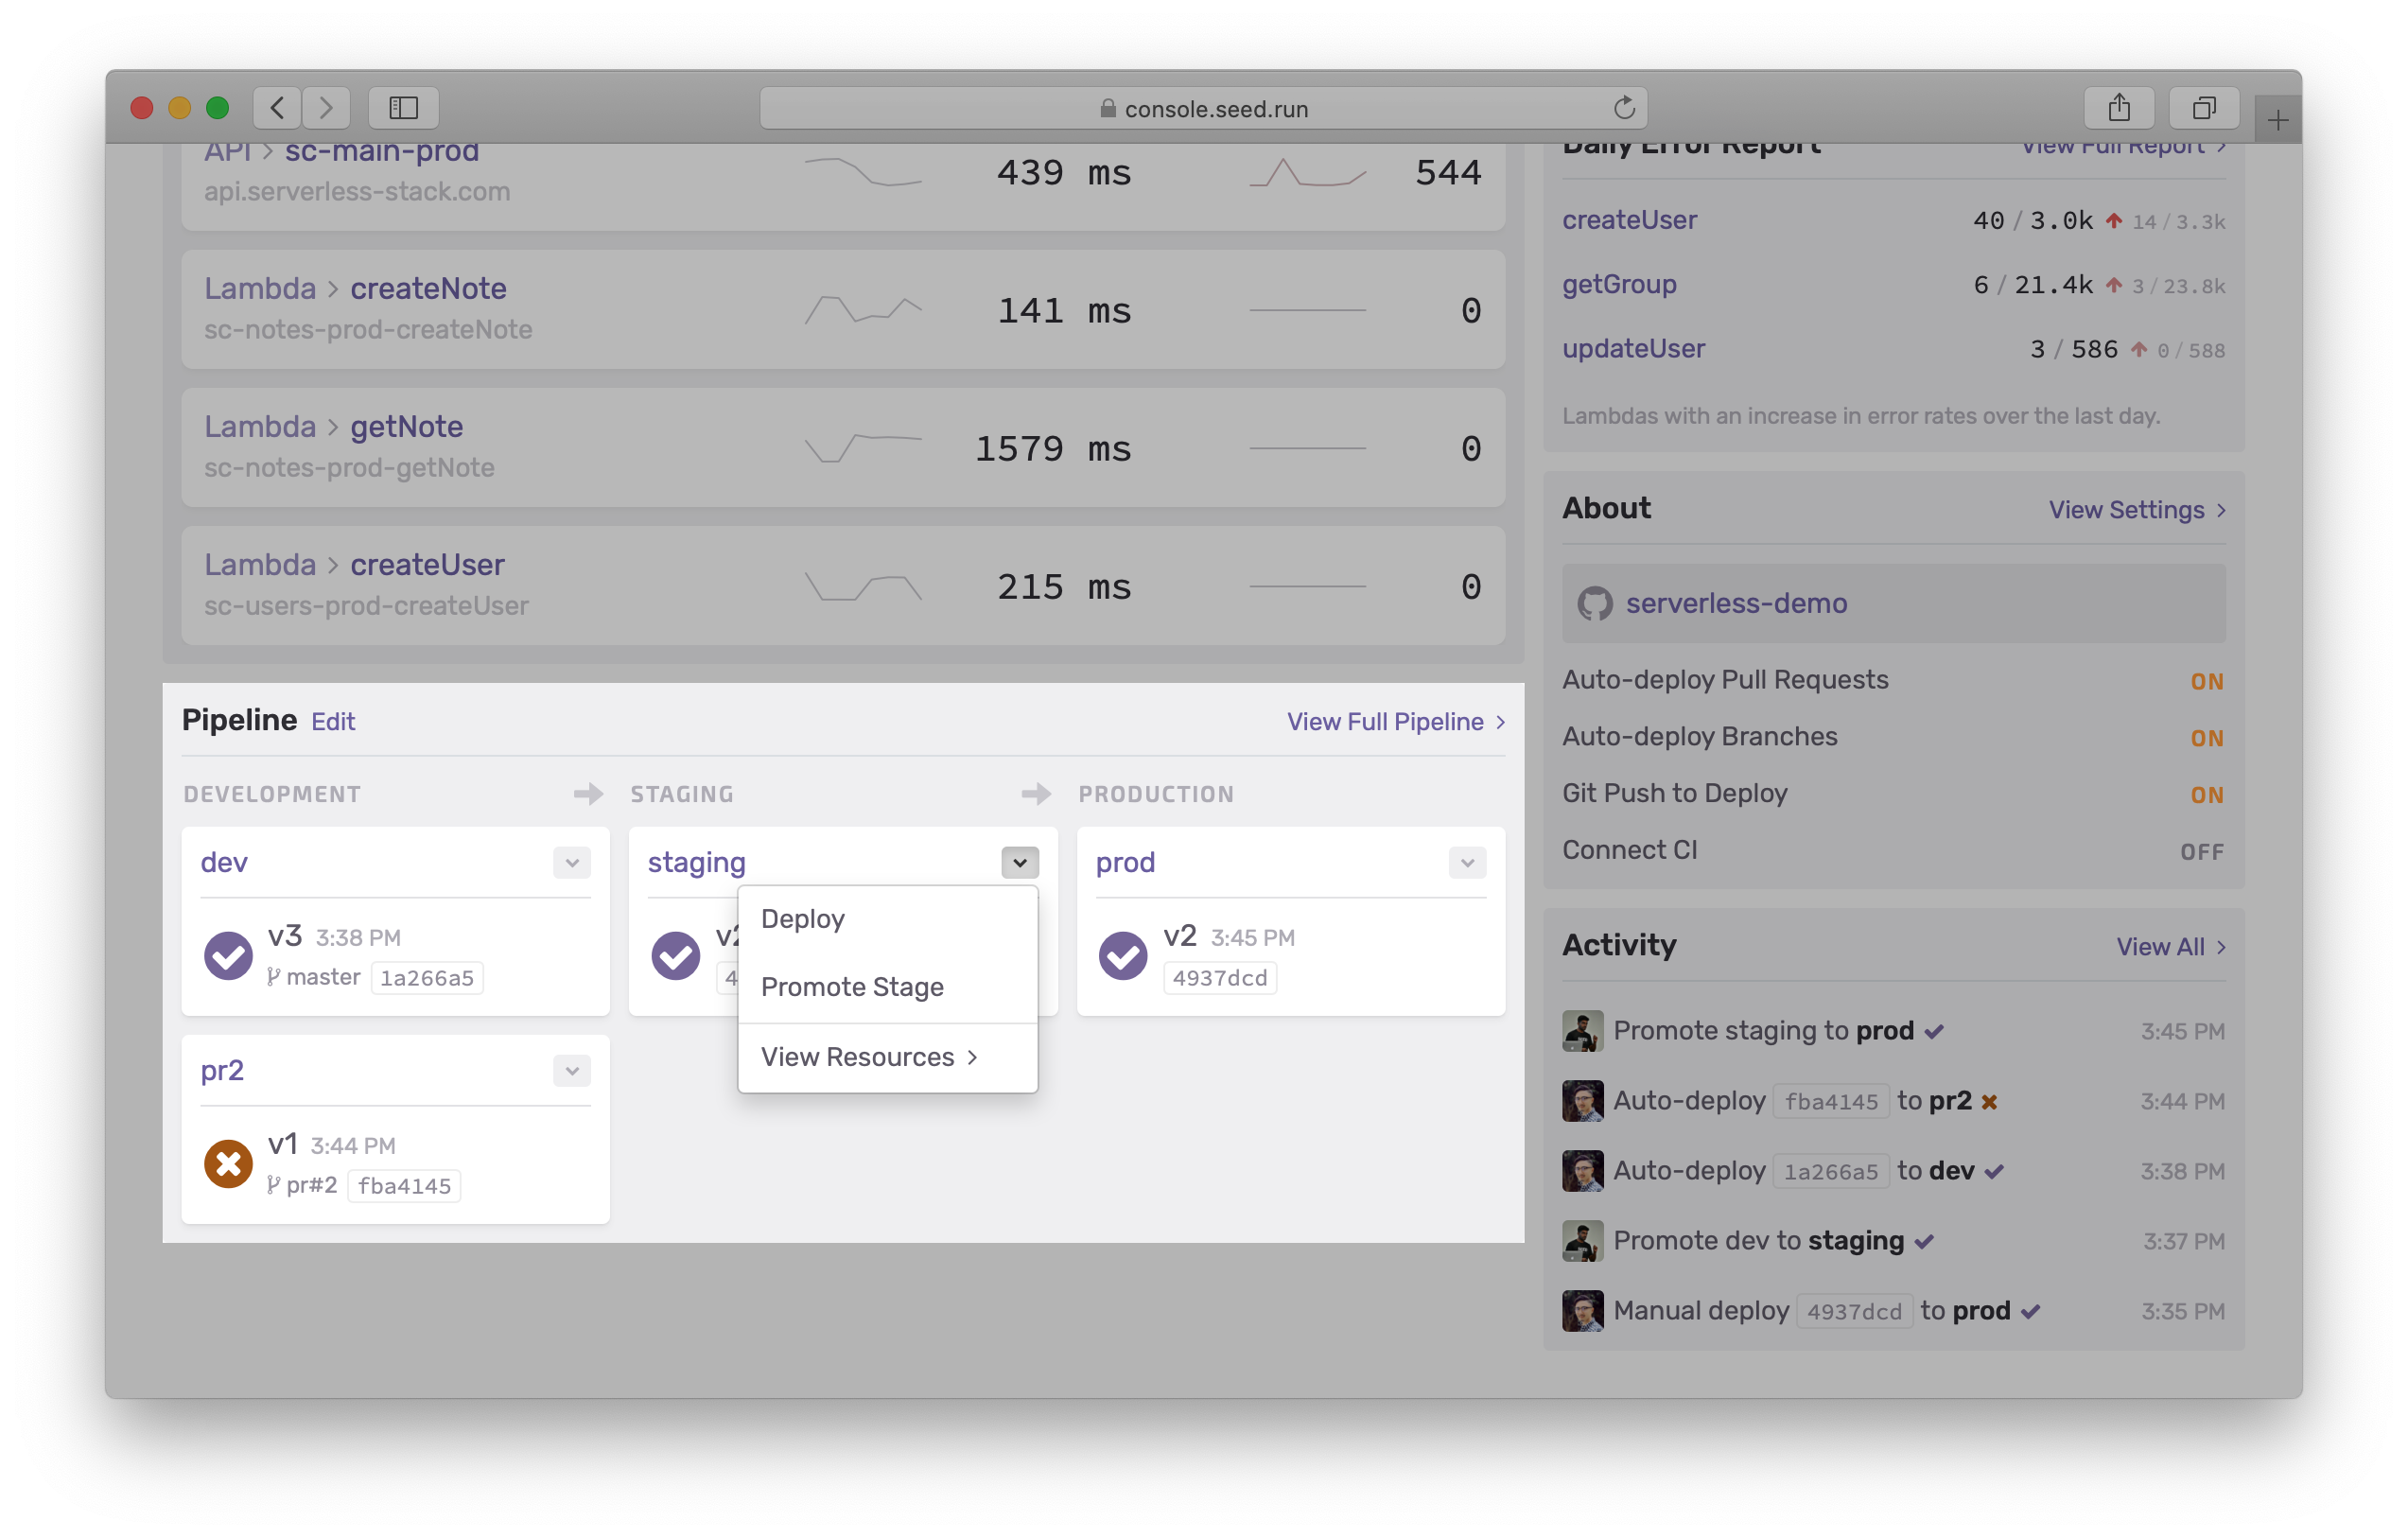
This new view gives you quick access to:
- The latest build across all stages
- Deploy to a stage
- Promote a stage
- View the resources in a stage
There are also handy links to view the full pipeline and to edit it.
Recent Activity
The new dashboard also shows you some of the recent build activity in your app.
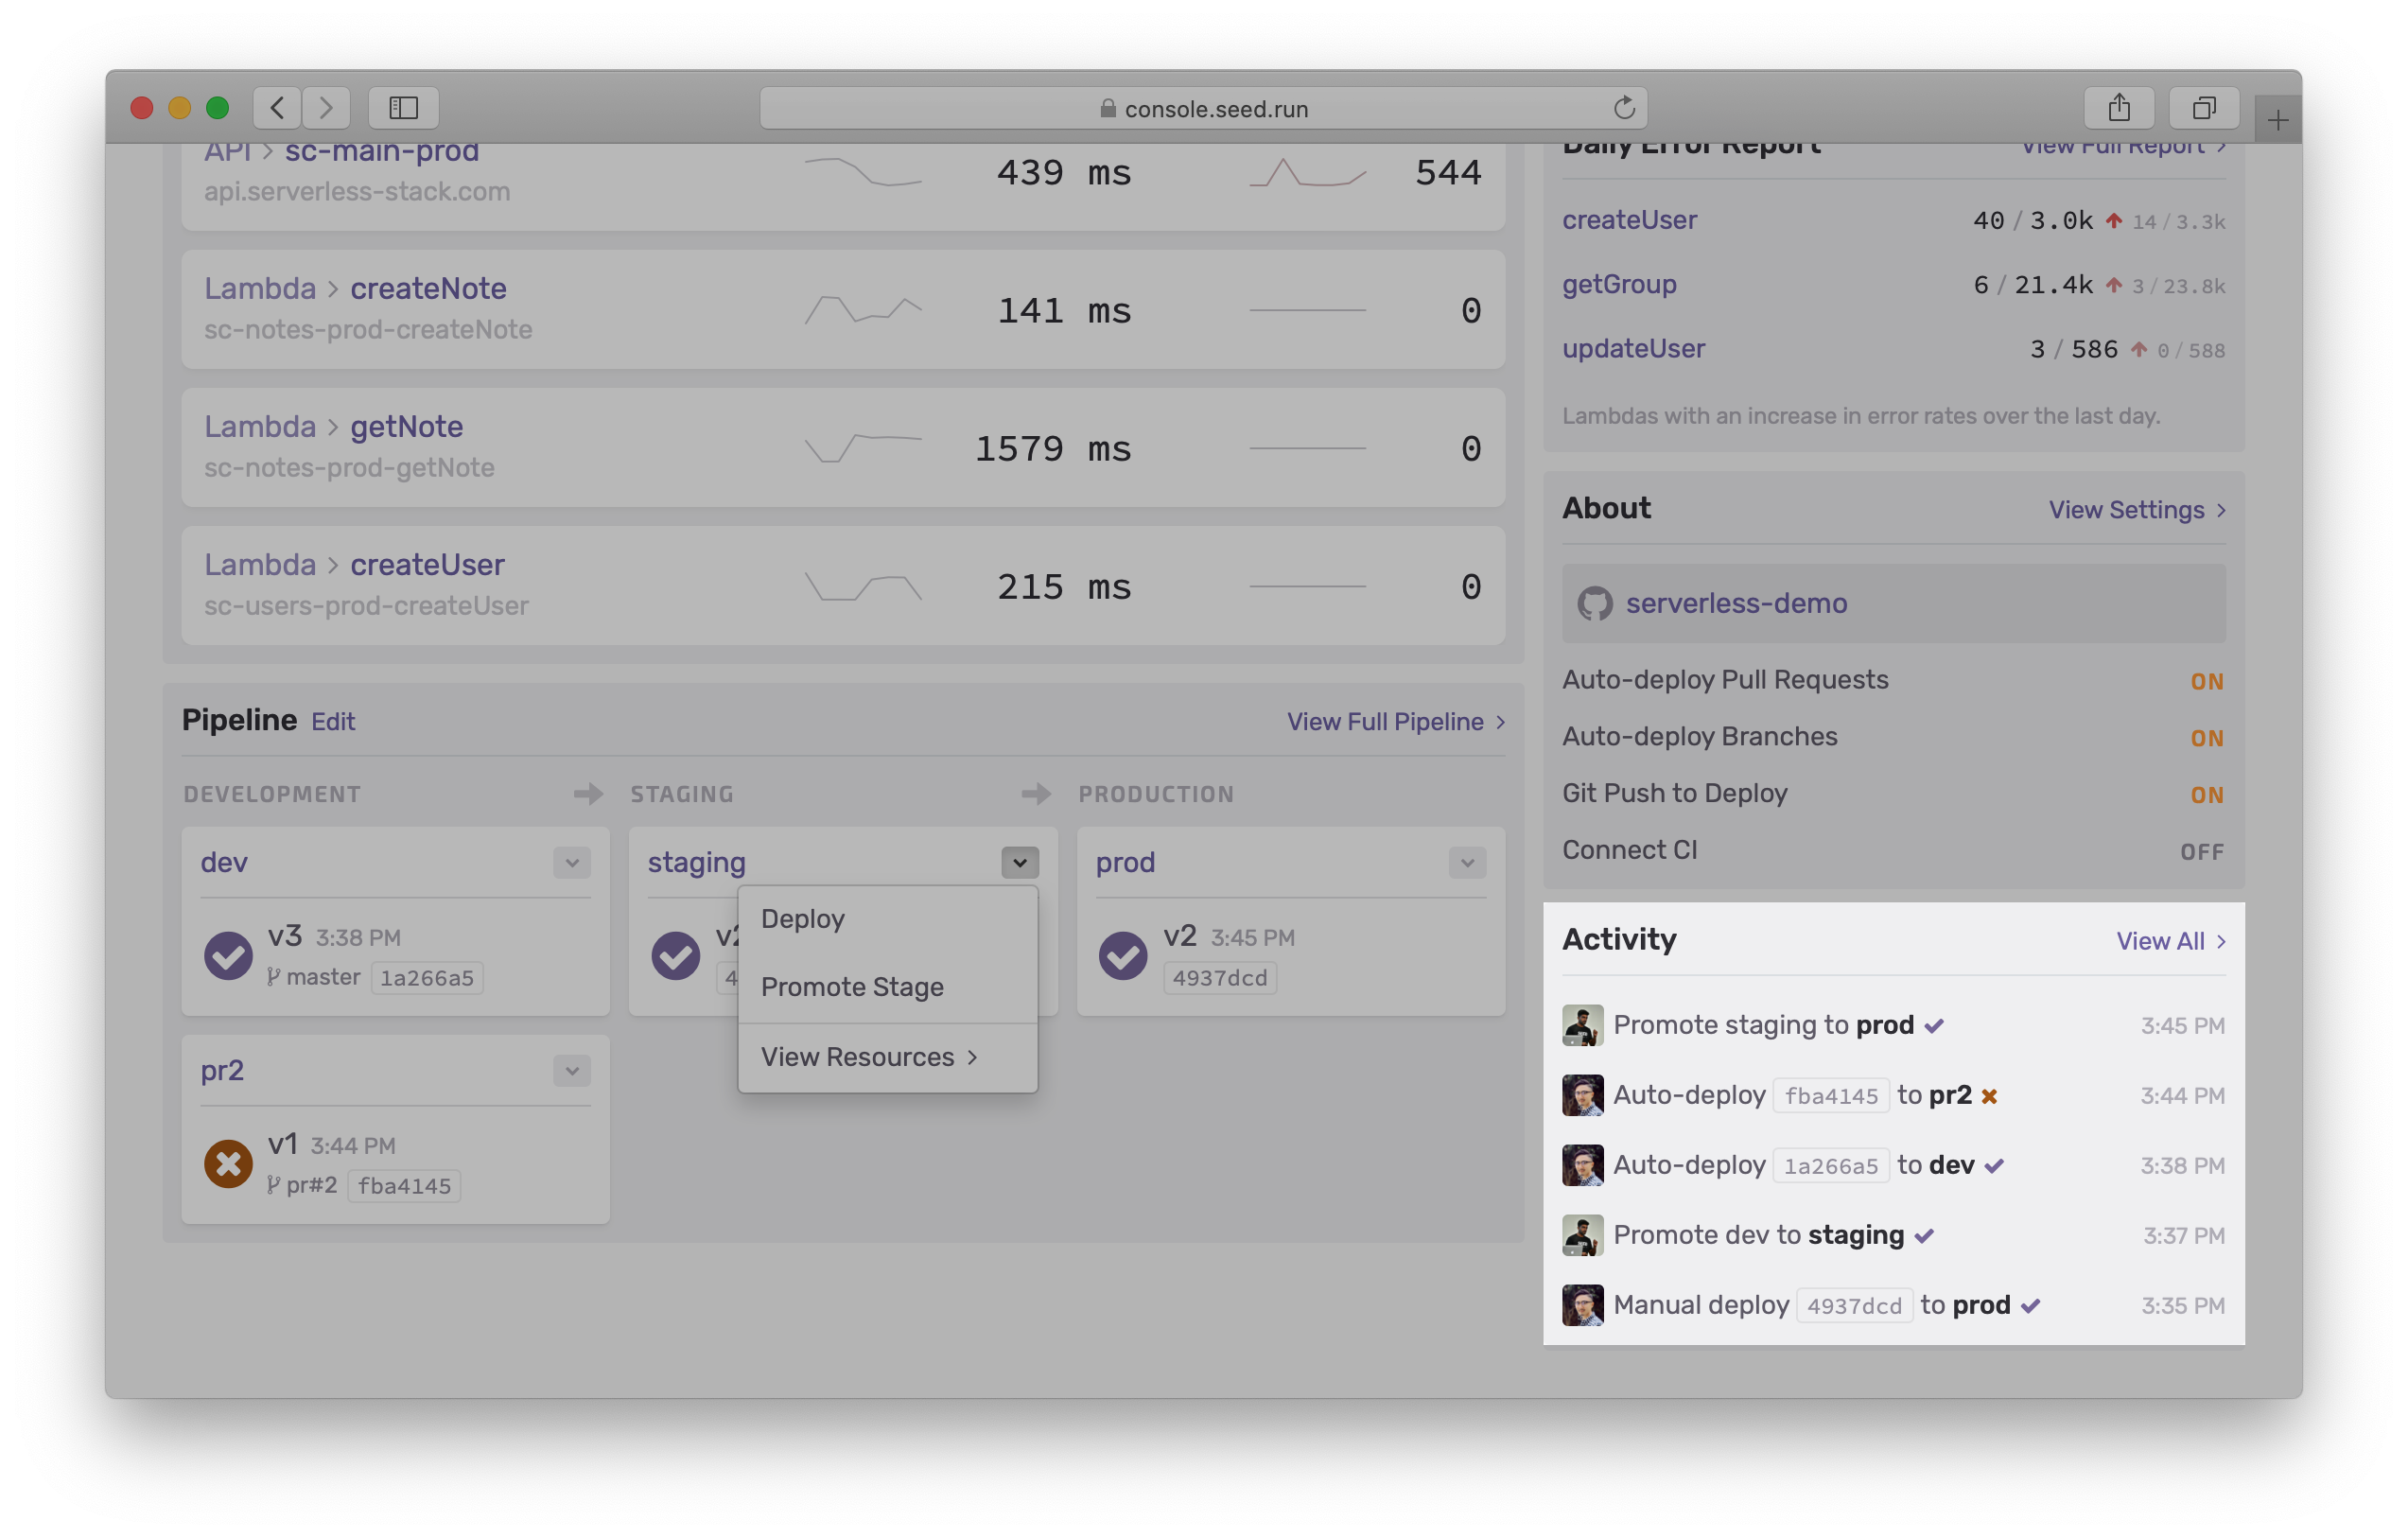
And you can click through to head over to the full activity view. More on this below.
Navigating to Stages
The navigation in the new dashboard gives you quick access to all of your stages as well.
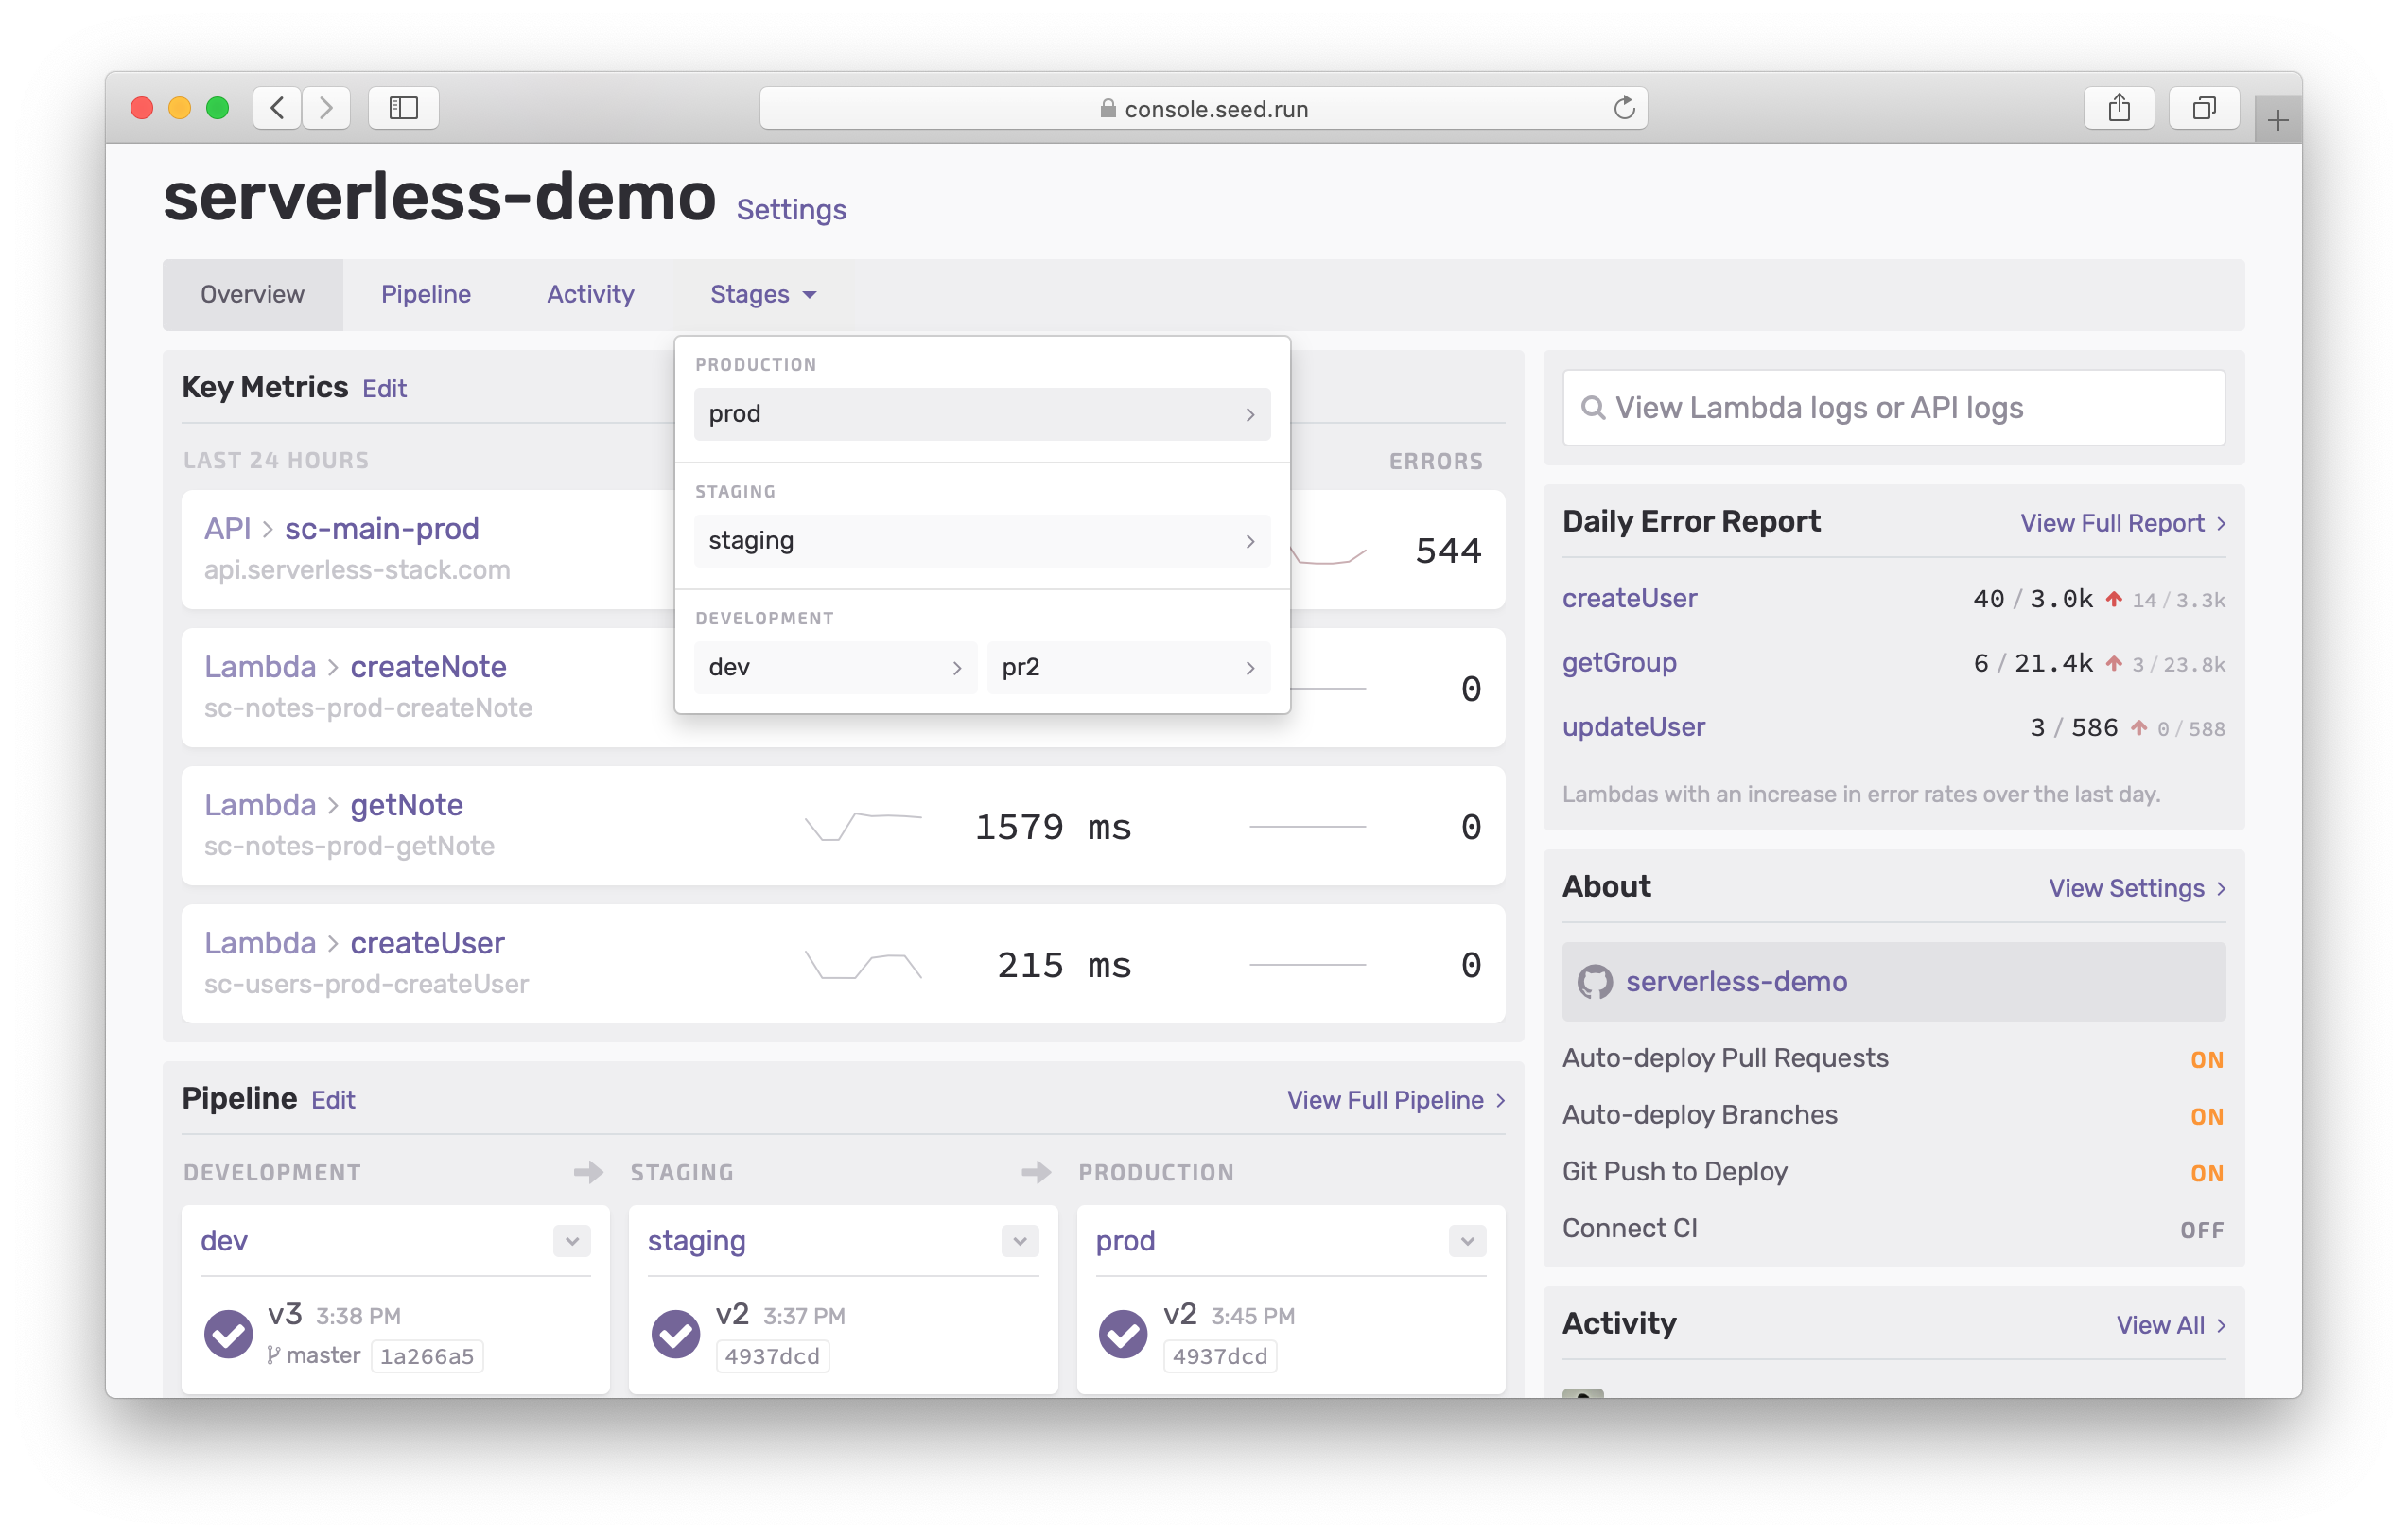
The stages view has also gotten an update in this release. Let’s look at that next.
Stages
We’ve made a couple of changes to the way stages are displayed in Seed.
We’ve moved the activity in a stage to its own view. We’ll look at this below. And, the resources in your app are now organized around APIs. Serverless apps are primarily used to power APIs and we want to make sure that we give you a good overview of the APIs in your app.
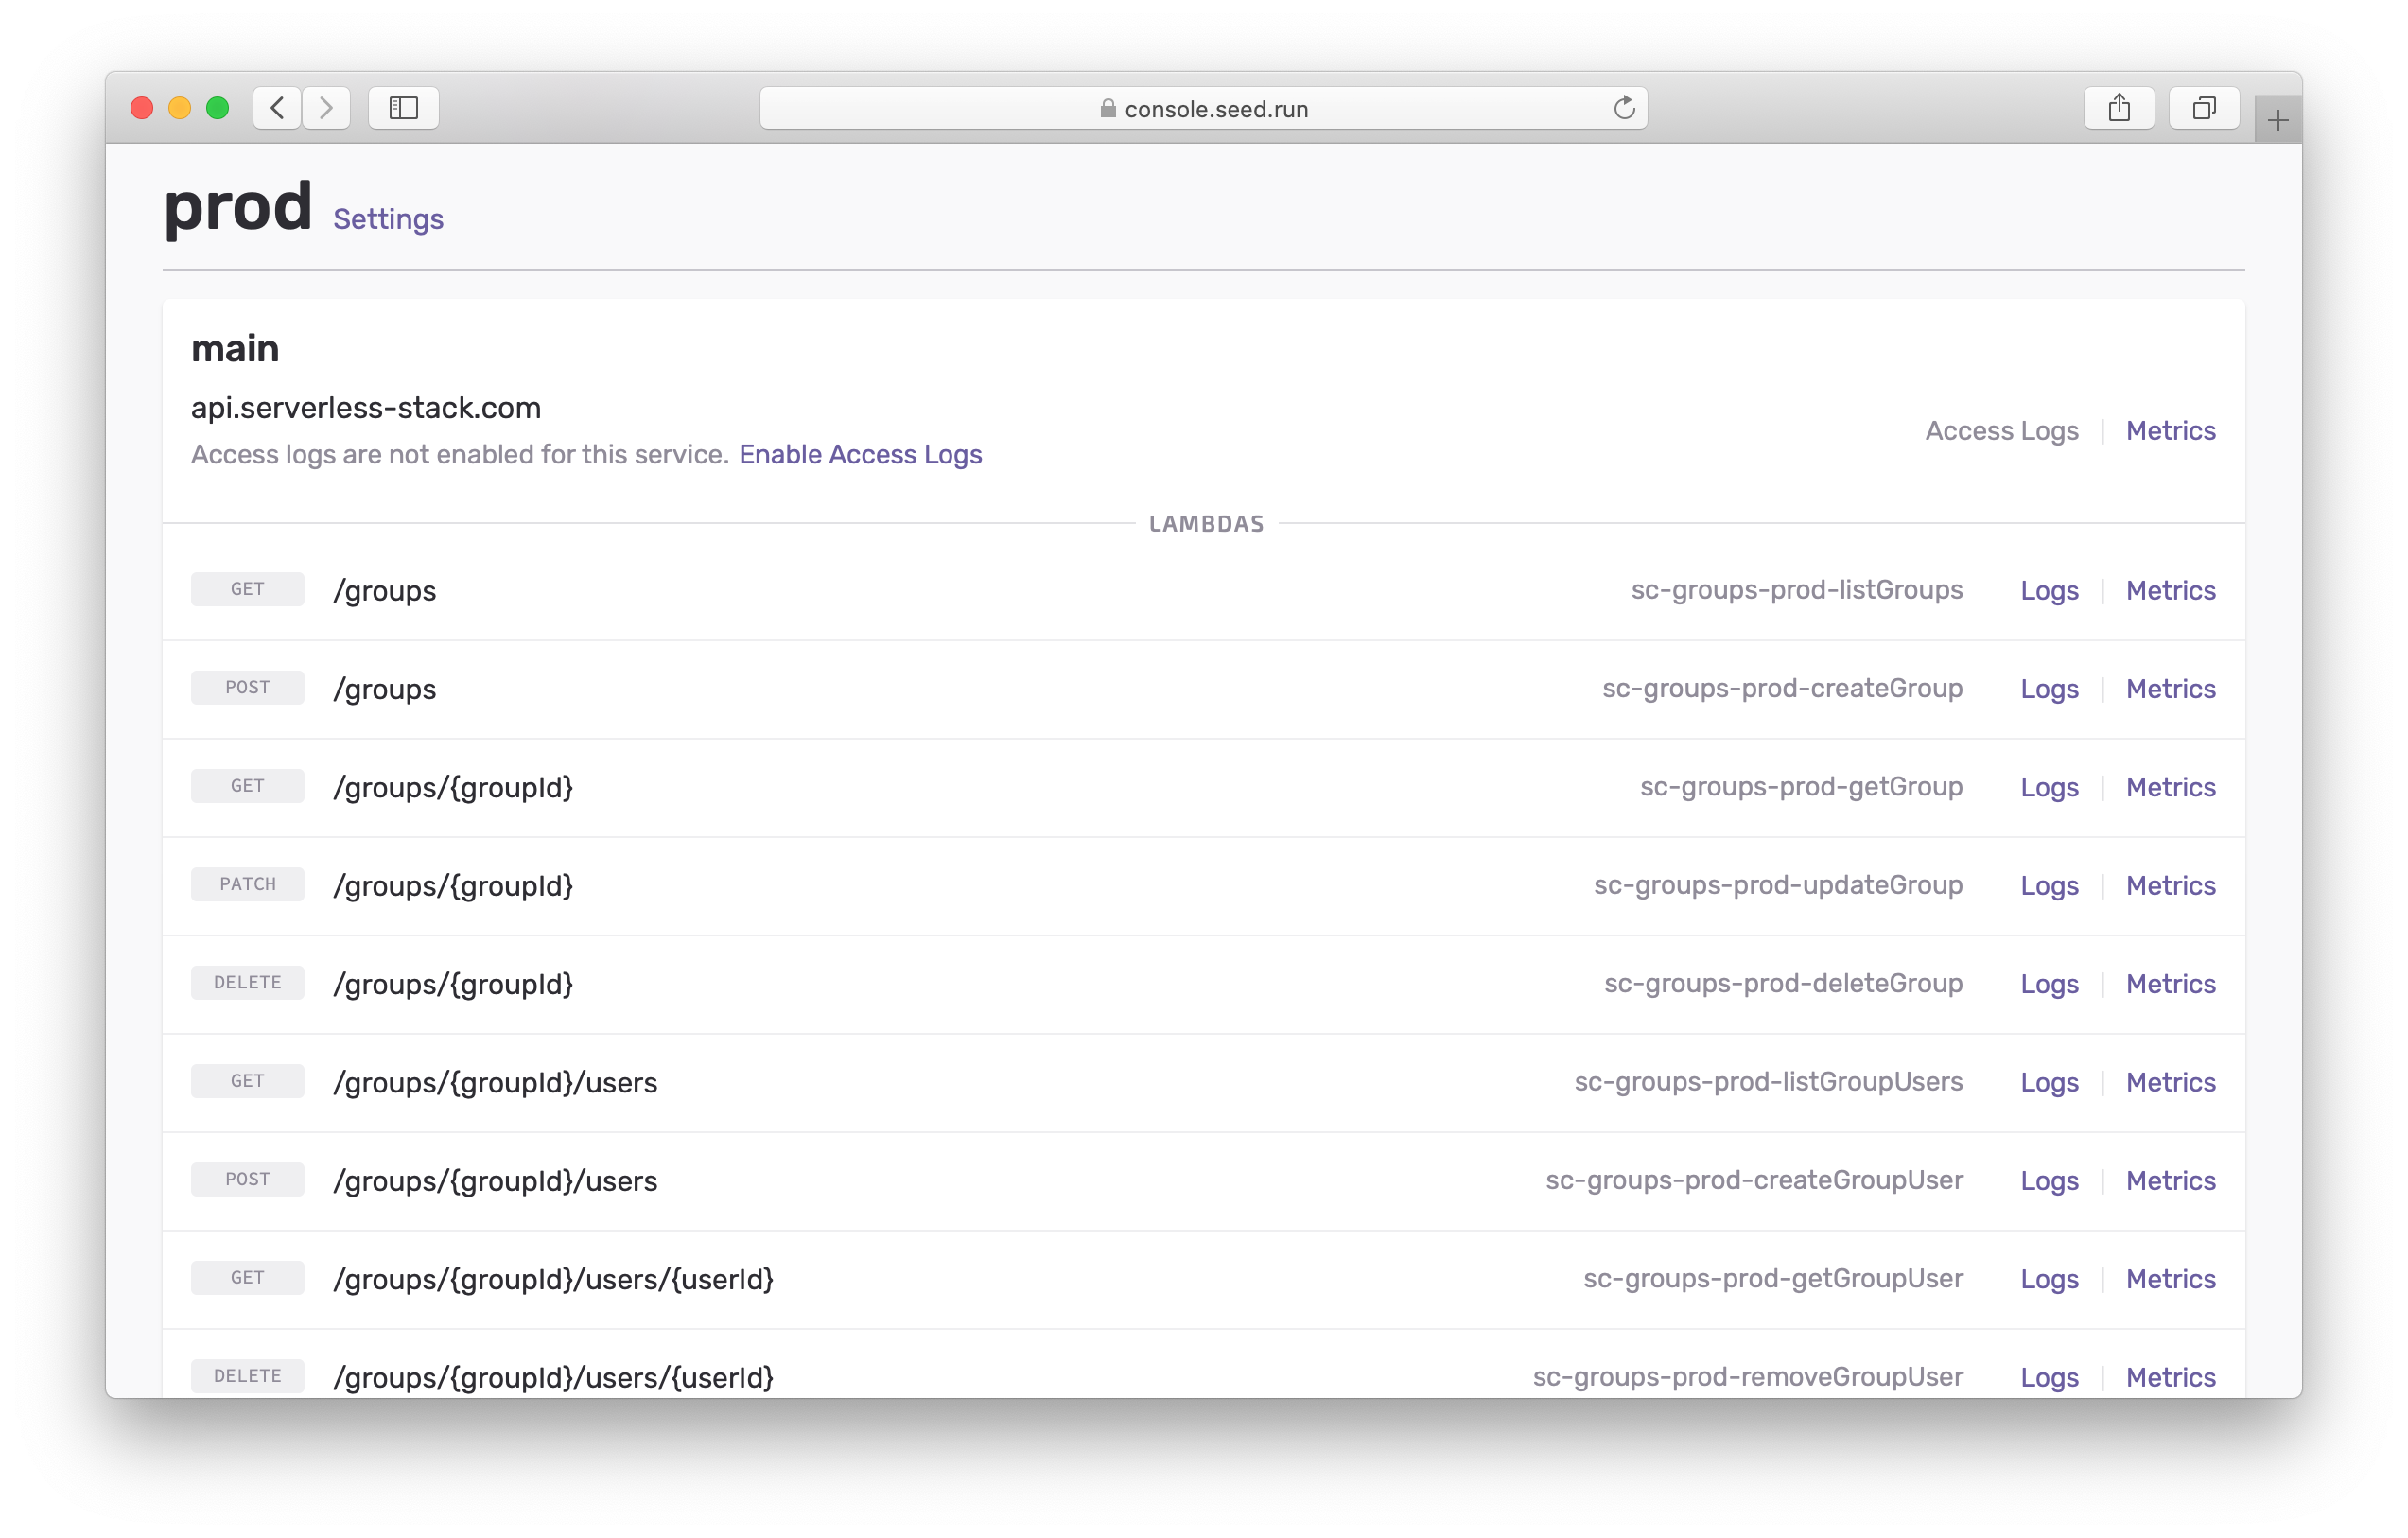
We figure out the routes in your API and organize your Lambda functions around it. When you are trying to debug an endpoint, you might not remember the Lambda function that’s powering it. This new table fixes that!
Activity
This update also features a major improvement to the way Seed displays the build activity in your app.
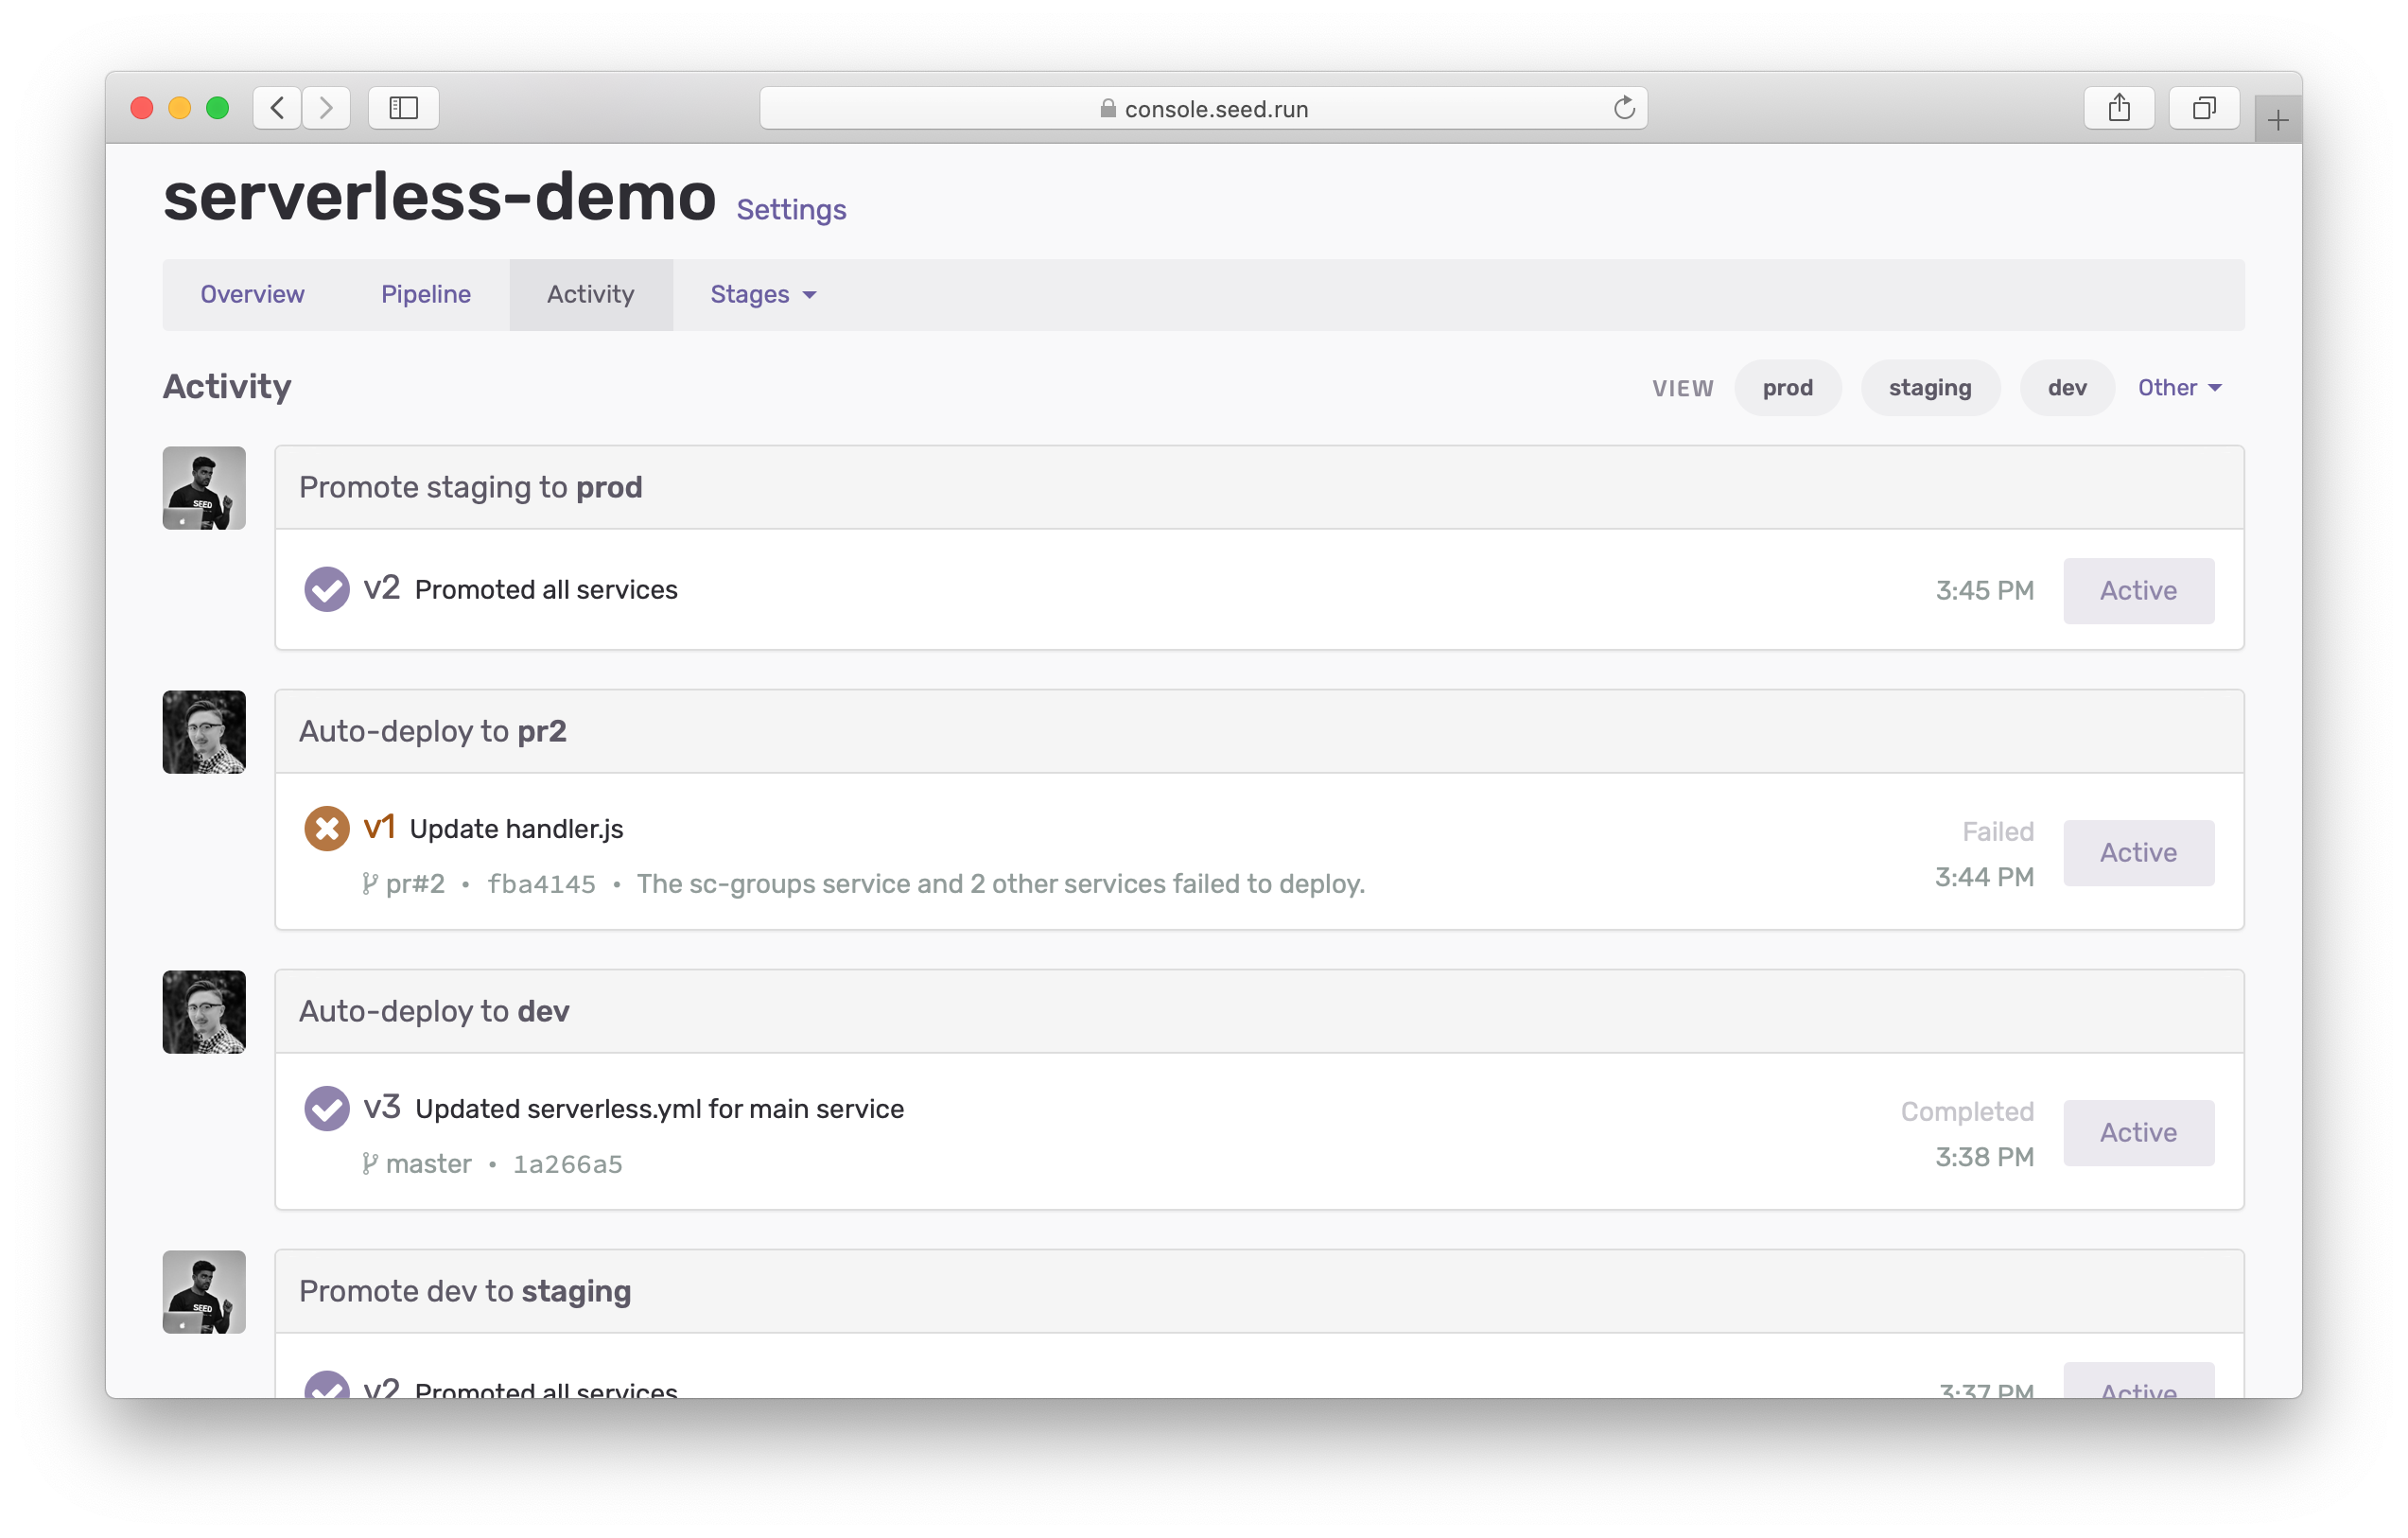
Previously, you had to jump around through the stages to be able to filter through the activity. With the new activity view, you have access to everything in one place.
- You can view the entire build activity for your app.
- You have 1-click access to view the activity for the most common stages.
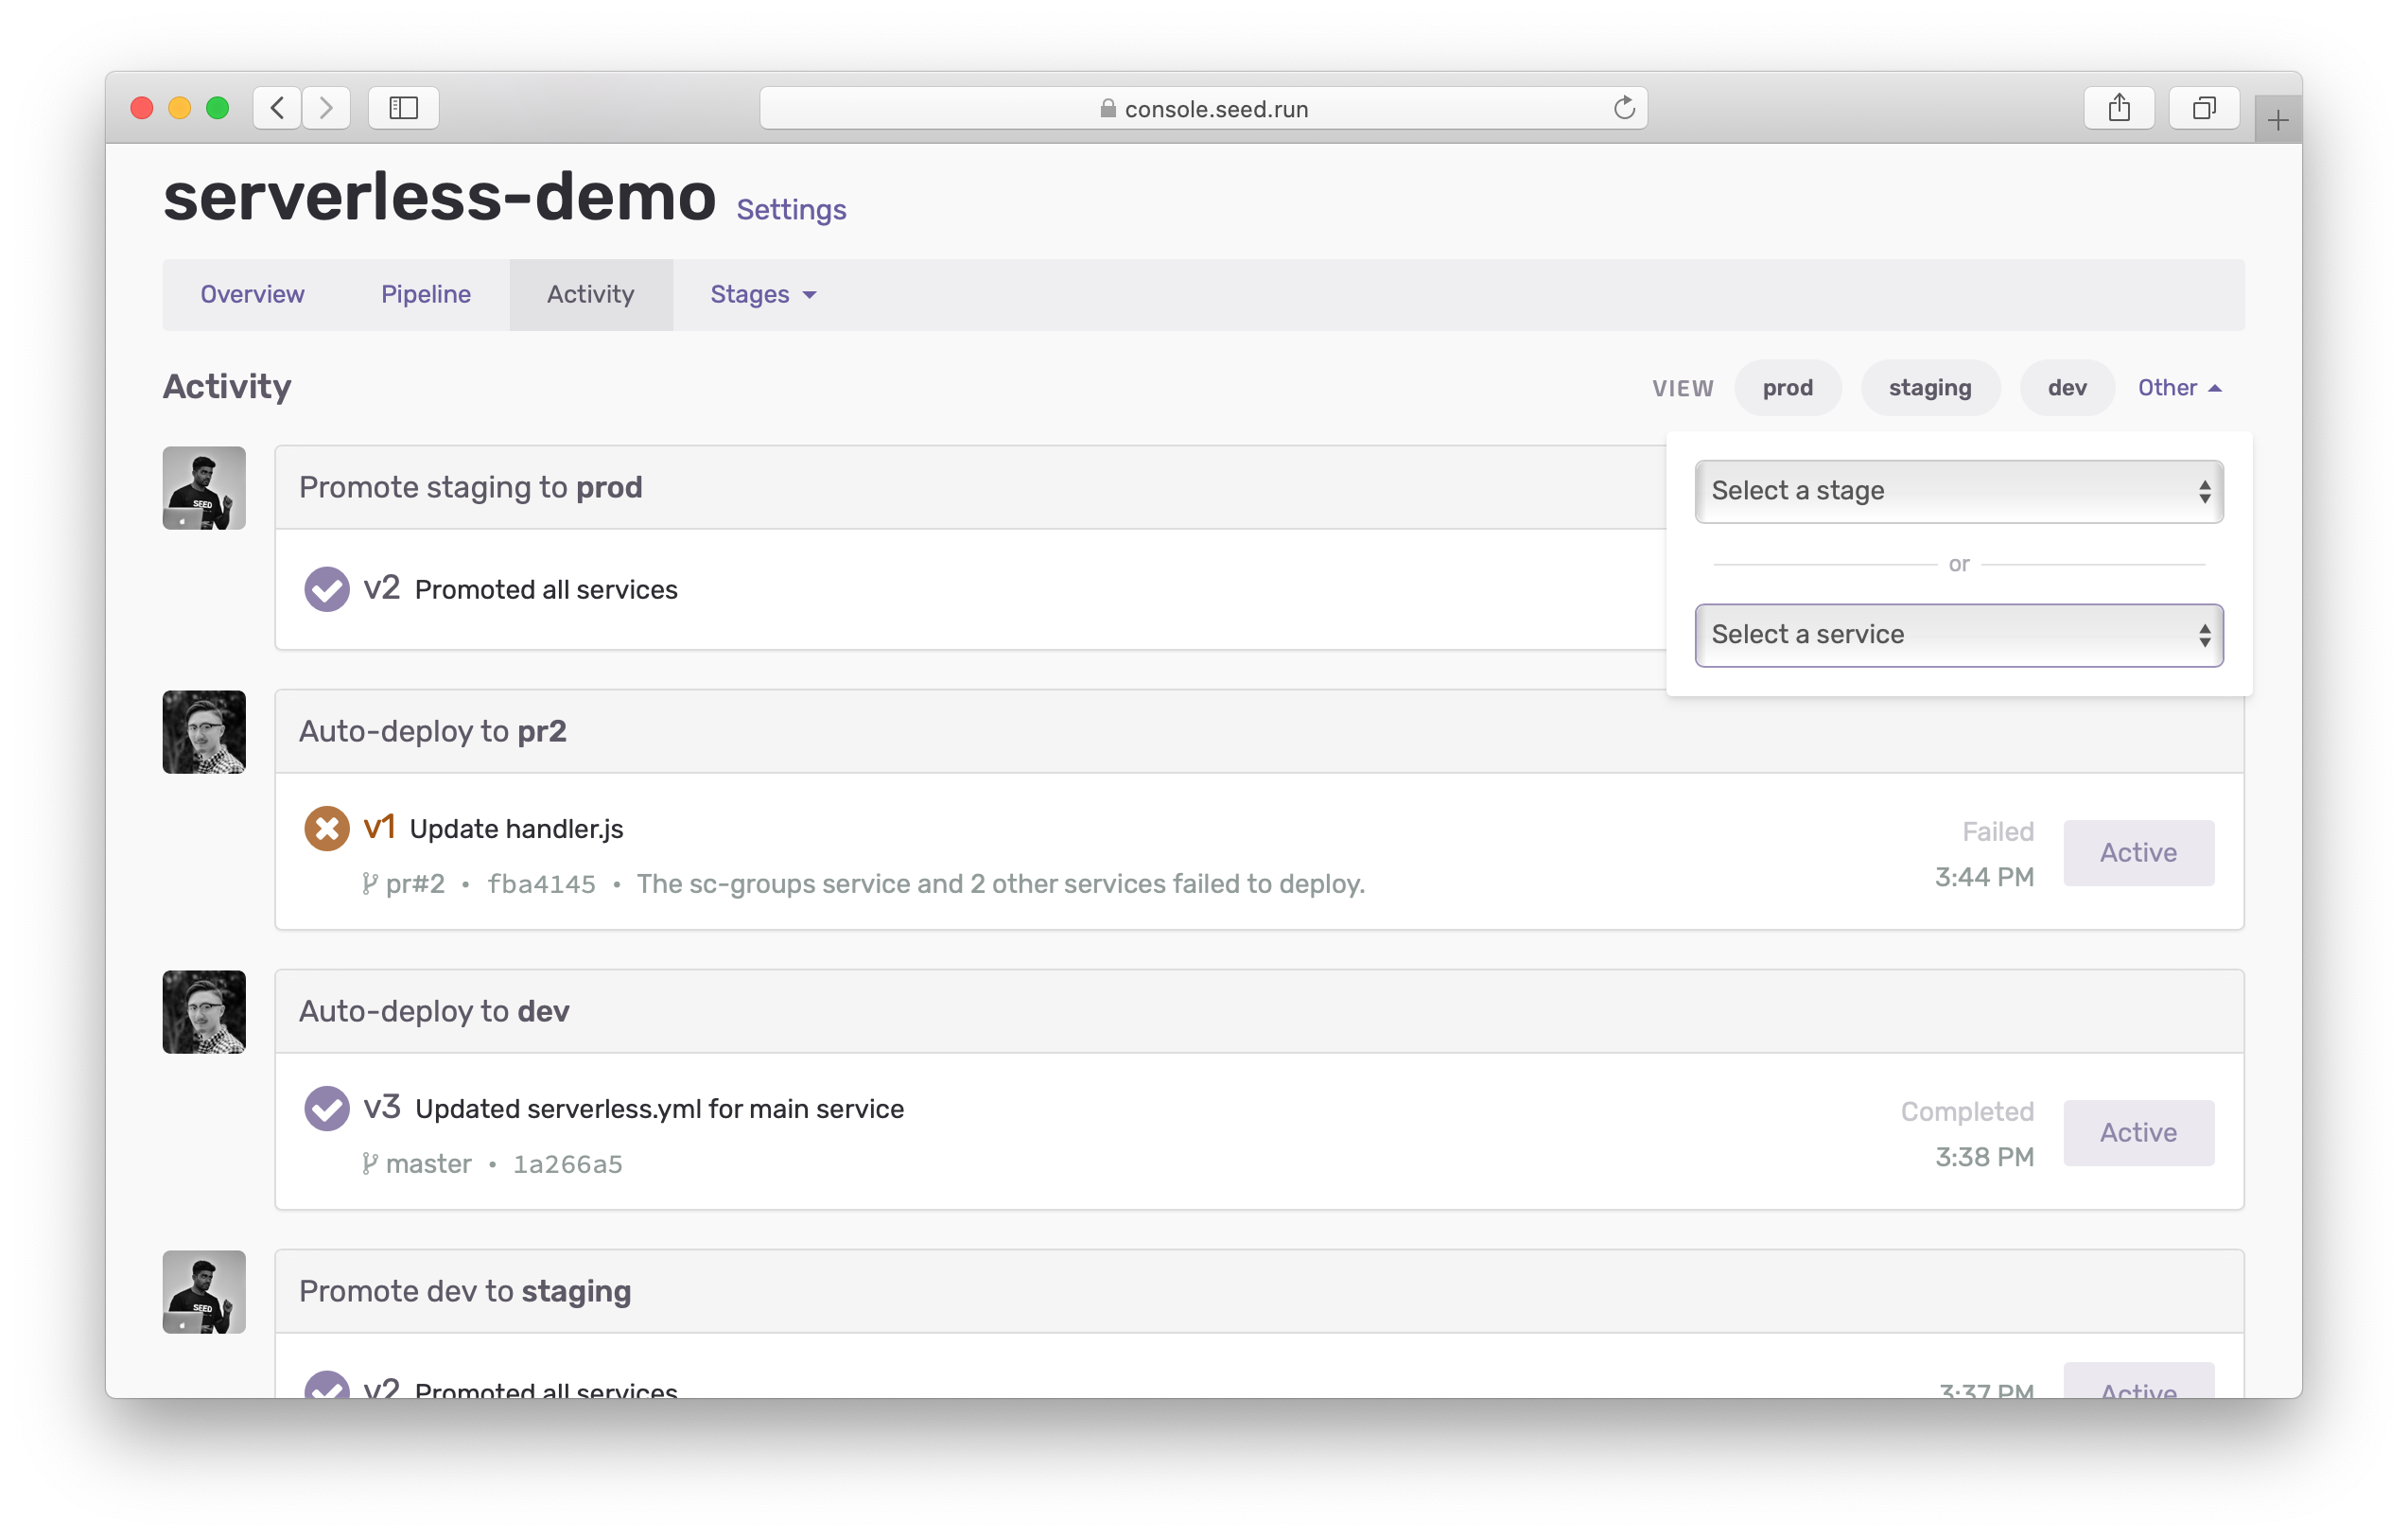
- Or pick and filter by any of the stages in your app.
- And, you can now filter by a specific service as well.
Summary
The new Seed dashboard allows you to easily deploy, manage, and monitor your Serverless app. It gives you a bird’s-eye view of your app’s pipeline, the health of your app, and any critical errors you should be looking at. We’d love for you to try out the new dashboard and to give us your feedback.
But before you head over to try it out, we’ve got one more little addition to tell you about!
Bonus
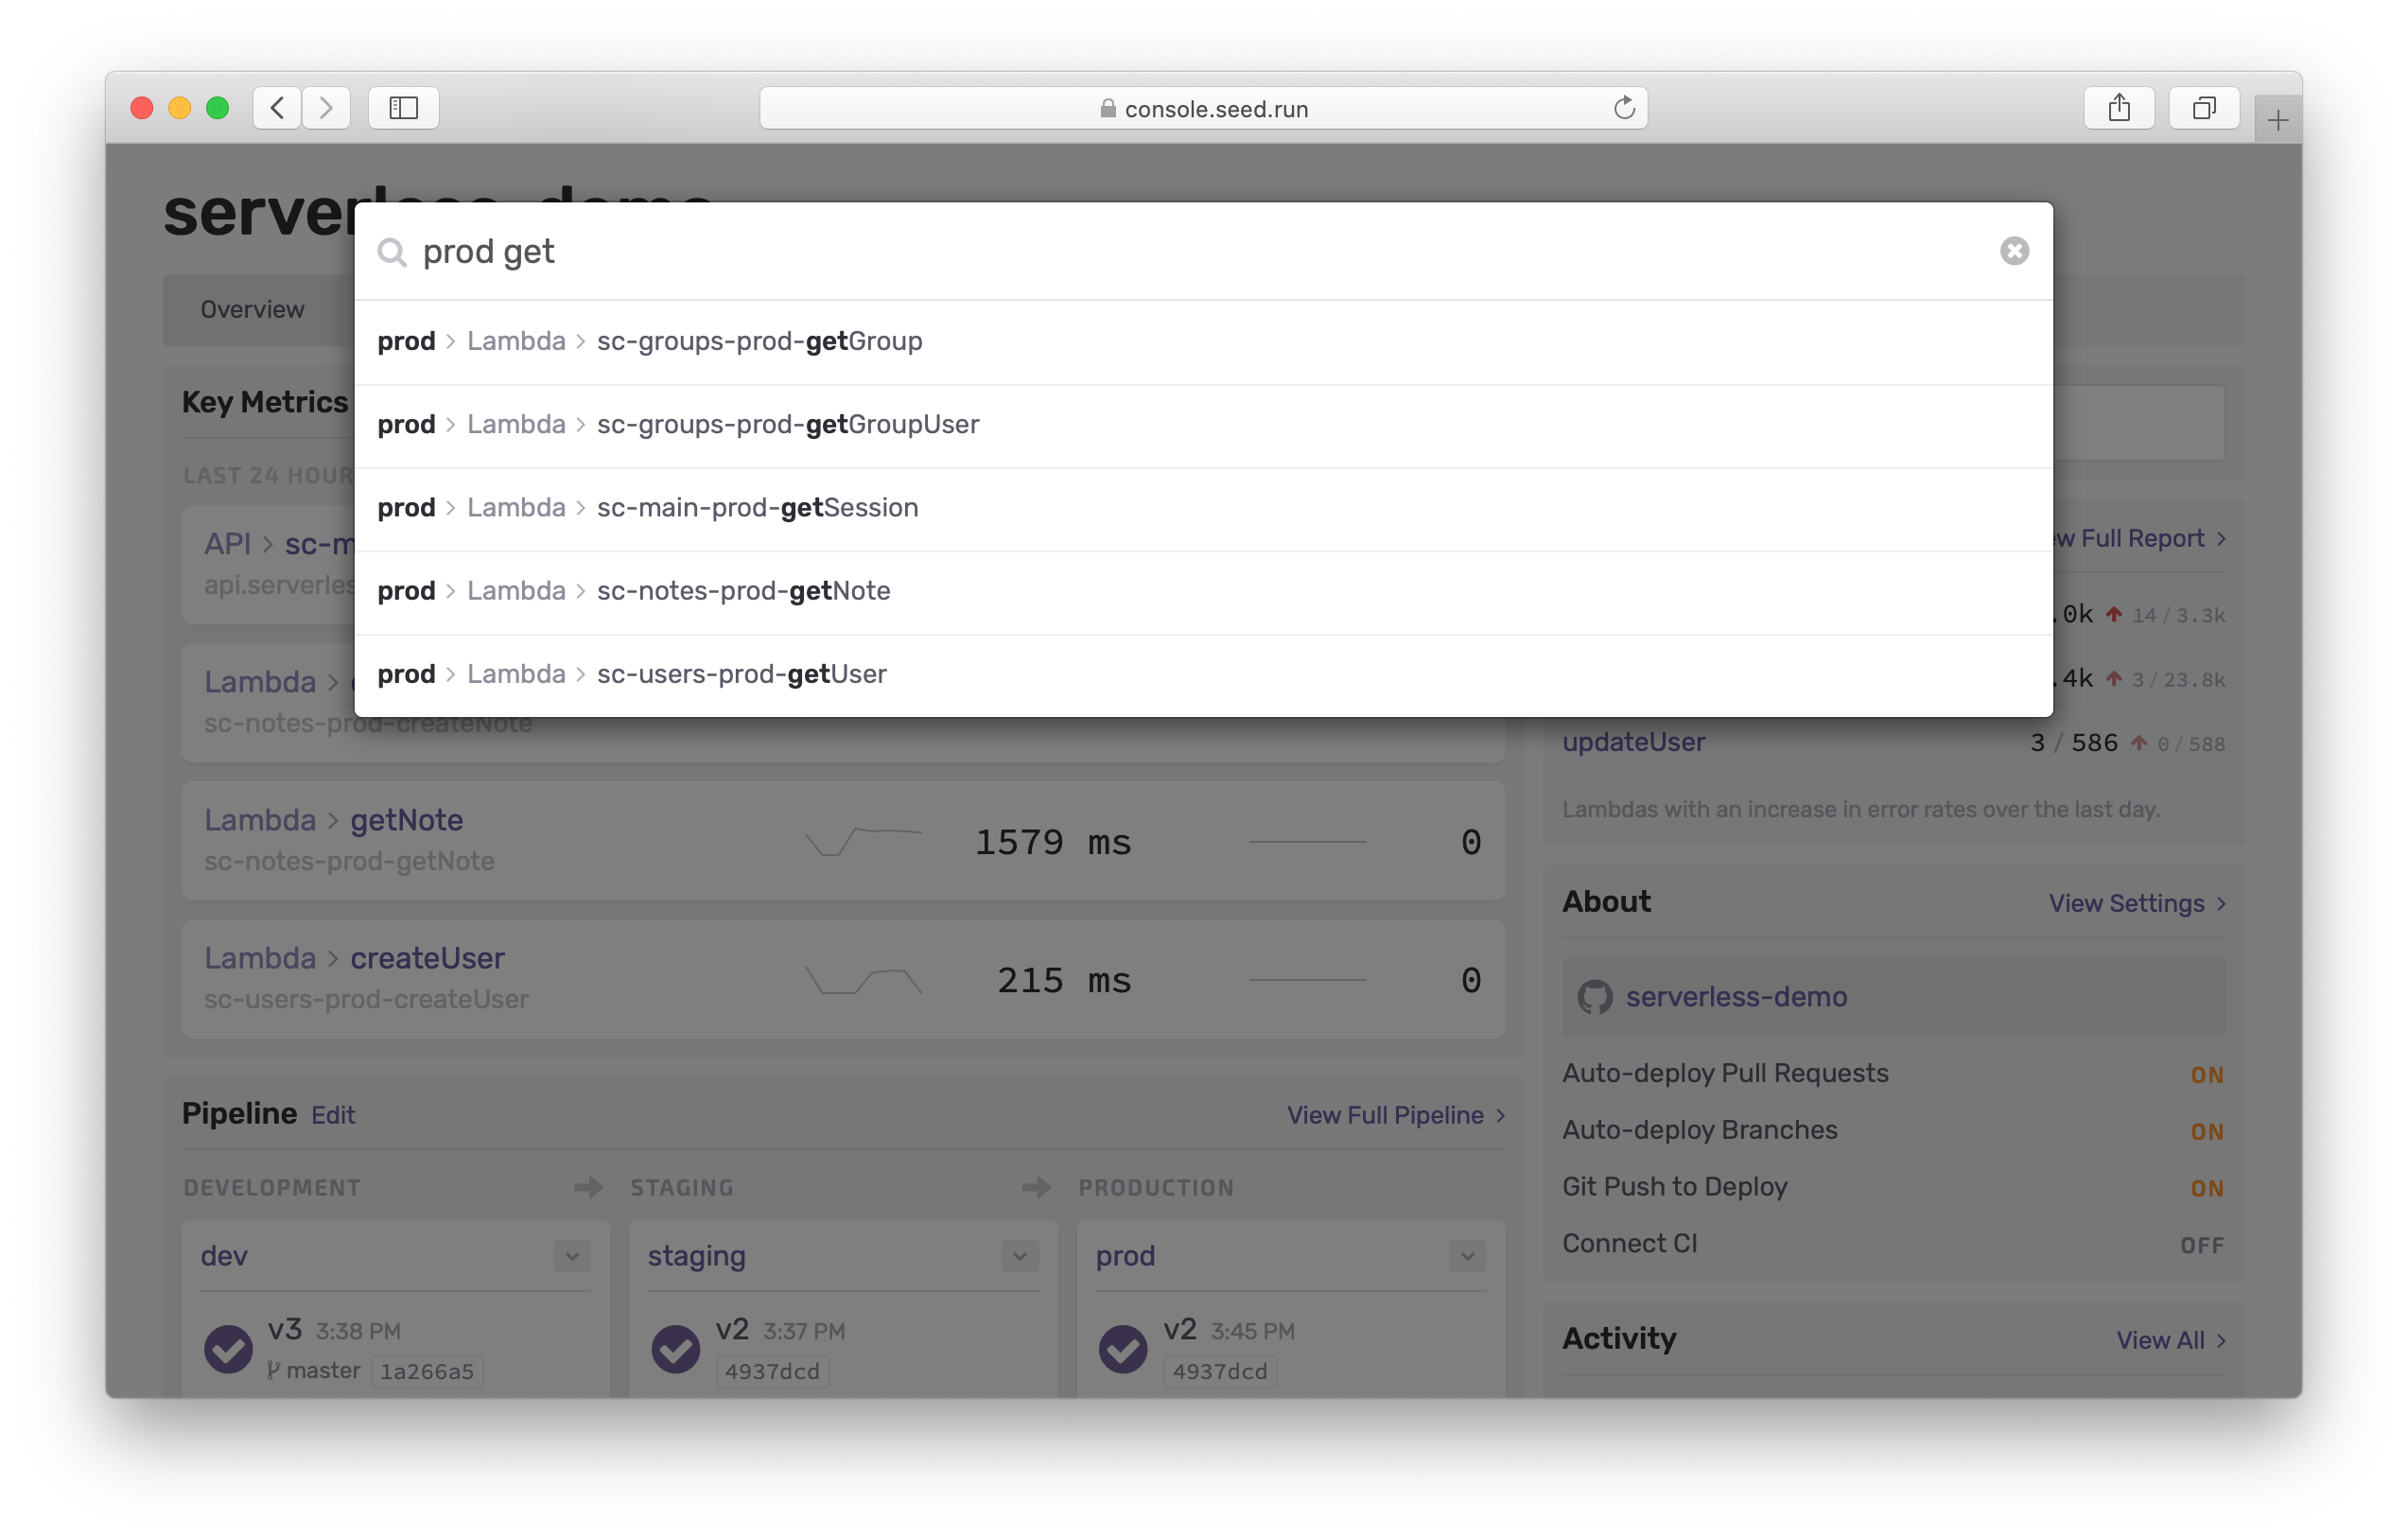
You can now search for the Lambda function that’s responding to a specific endpoint in your app.
Let’s look at what’s going on above and how this works.
- Say you’ve just received an alert that a specific API endpoint (say
https://api.serverless-stack.com/groups/123/users) is giving an error. - You simply head over to the Seed dashboard and paste that URL in the search field.
- And Seed will instantly find the best match for the URL in your API routes.
- In this case it’s —
/groups/{id}/usersand Seed has found the associated Lambda function. - Now you can easily view the logs and figure out what’s going on!
We’ve been using this search internally and it’s been amazing. No more having to fumble around trying to figure out which Lambda function maps to which endpoint. Simply copy, paste, and go!
Do your Serverless deployments take too long? Incremental deploys in Seed can speed it up 100x!
Learn More