New and Improved Serverless Logs
We’ve got a really exciting update to Seed that we’d like to share. We’ve completely redesigned how Seed displays your Lambda and API Gateway logs.
Just some quick background before we dive into the details.
Background
One of the biggest complaints we hear from Serverless developers, revolves around debugging. Due to the inherently managed nature of Serverless, debugging issues has always been a hassle. To make matters worse, CloudWatch (the primary way to work with logs in AWS) just isn’t very user friendly. This can make the development experience for Serverless needlessly painful.
At Seed we not only build for other startups that are using Serverless, we use it ourselves as well! Seed is built entirely on Serverless. So we know firsthand how painful it can be to work with logs in your Serverless app.
We spent the last couple of months thinking from the ground up, what the ideal Serverless logs experience would look like. It lead us to working on supporting a couple of key development workflows really well. We rolled out this update over the holidays but we wanted to wait till the new year to announce it.
So without further ado, I’d like to walk you through the new and improved logs interface in Seed.
Lightning fast navigation
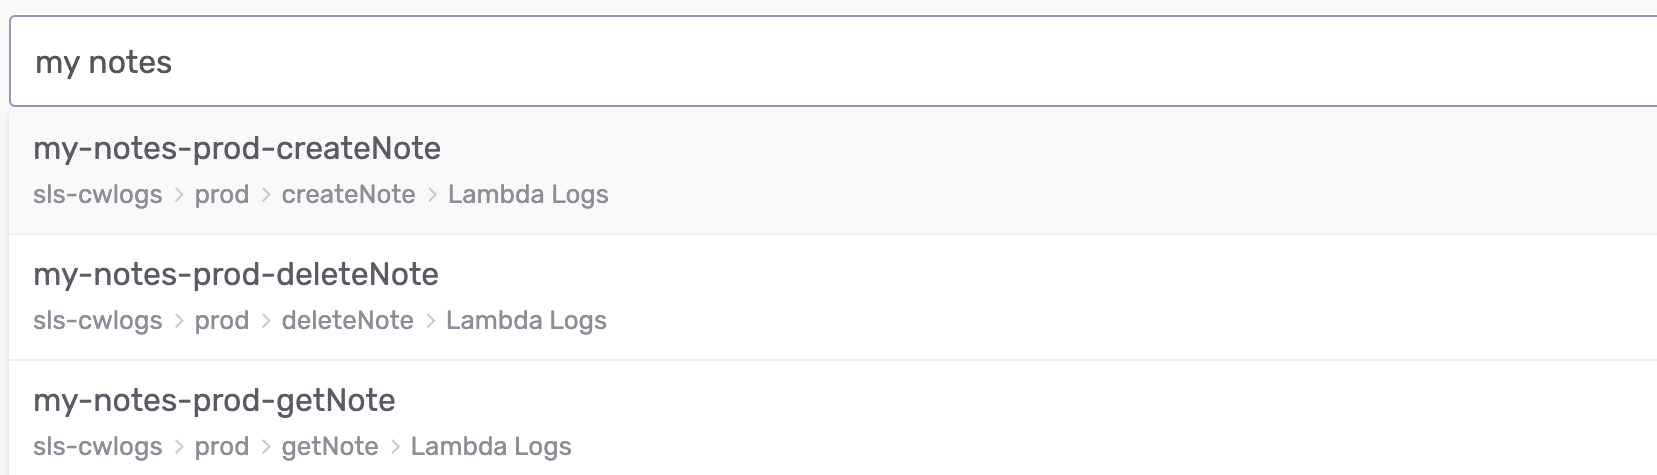
Any reasonably sized Serverless app has scores of Lambda functions. This means that navigating to the logs you are looking for needs to be really fast.
Simply start typing the name of the Lambda function (or service name) to filter through all your functions and API Gateway endpoints to navigate to the logs you are looking for.
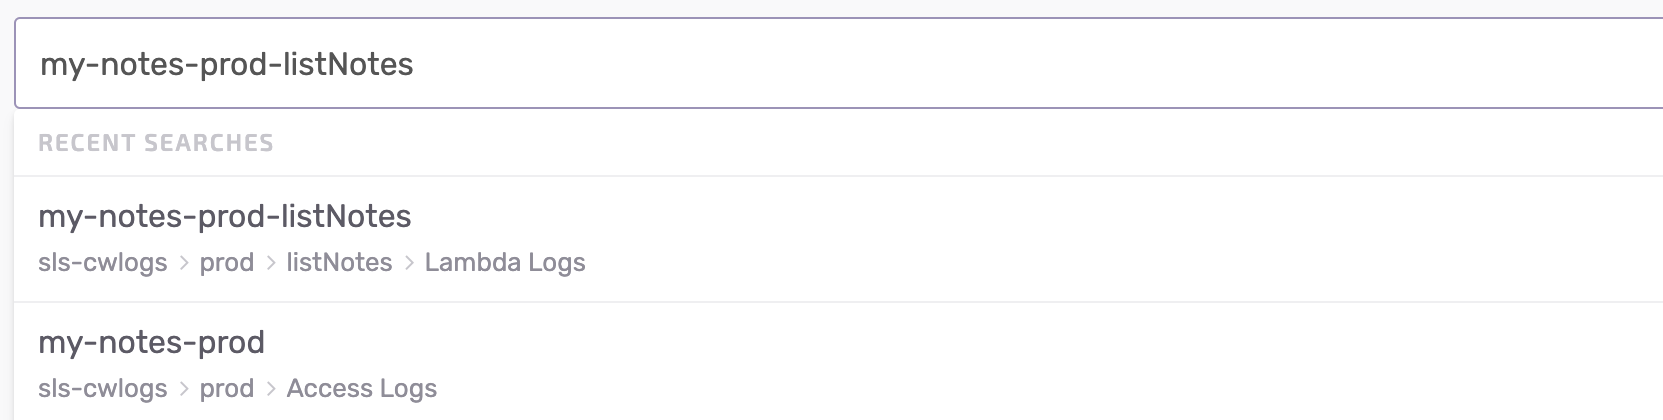
Seed will also remember all your recent searches. This comes in handy when you are developing and going back and forth between a couple of Lambda functions.
Live logs
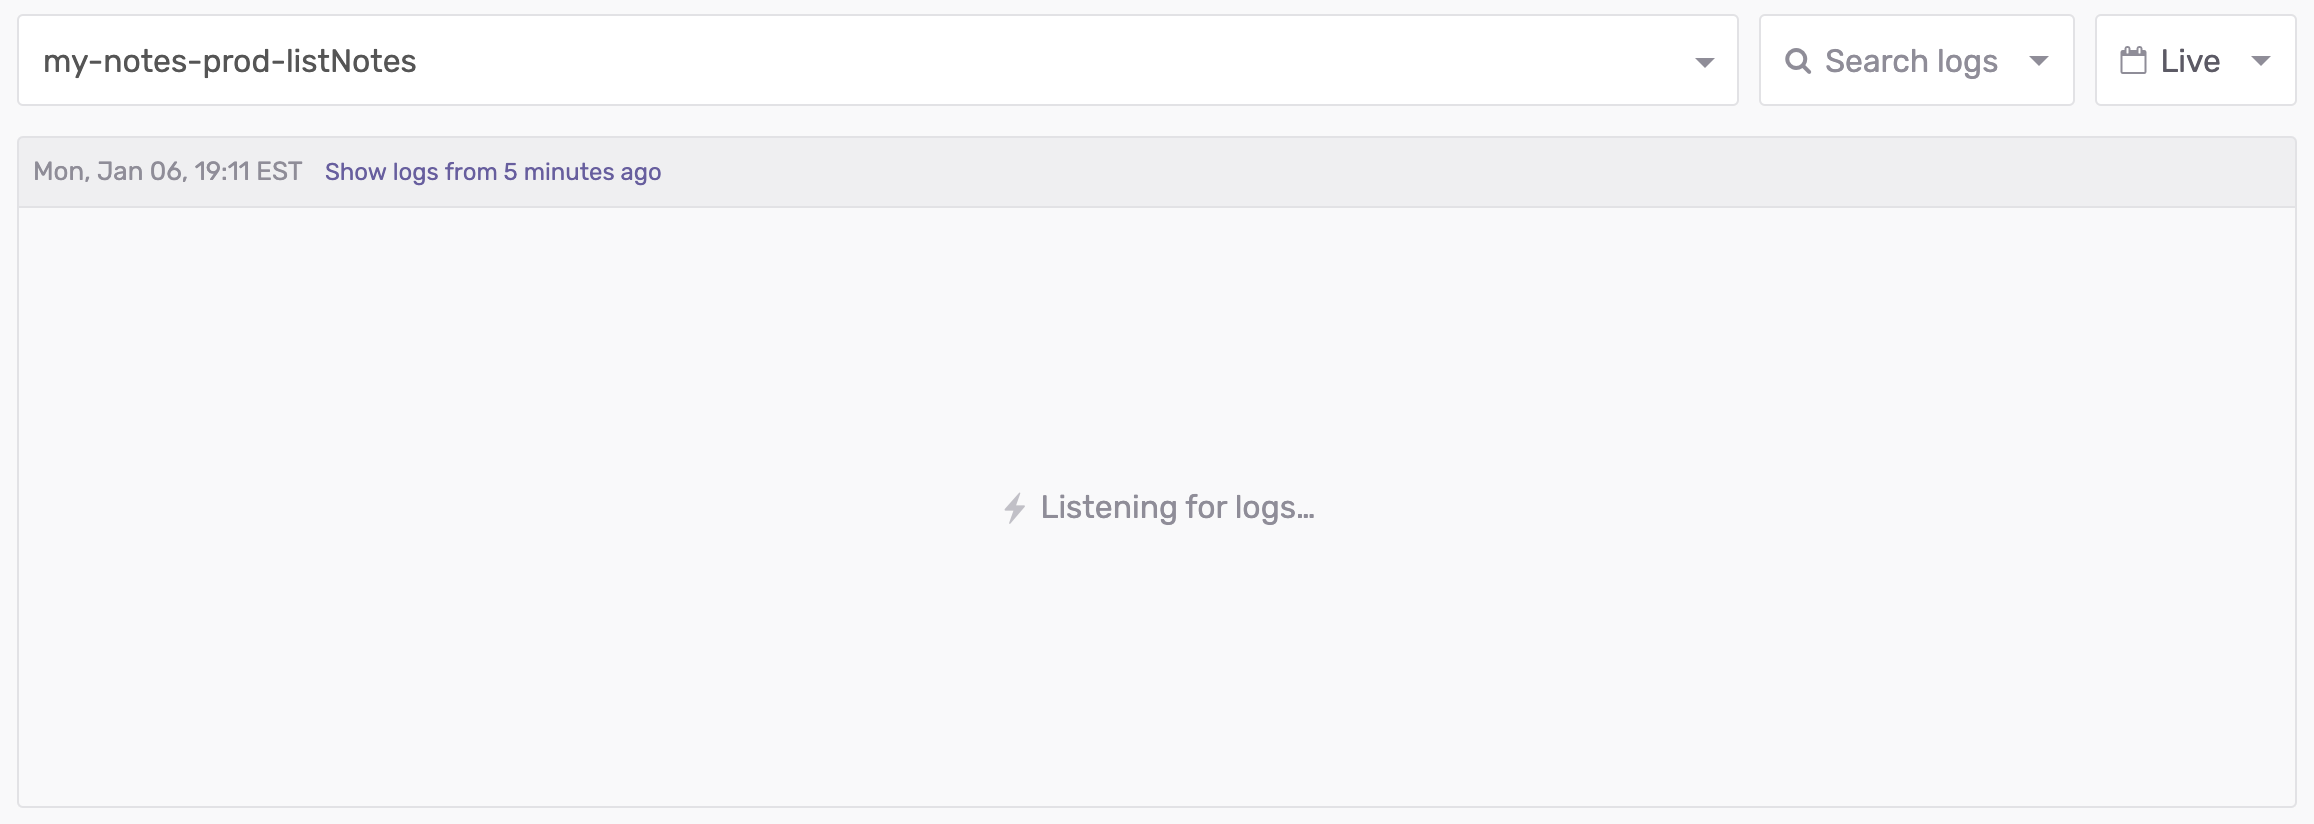
Once you navigate to the logs you wanted to see, Seed will give you a live view of the logs as they come in.
Lambda requests
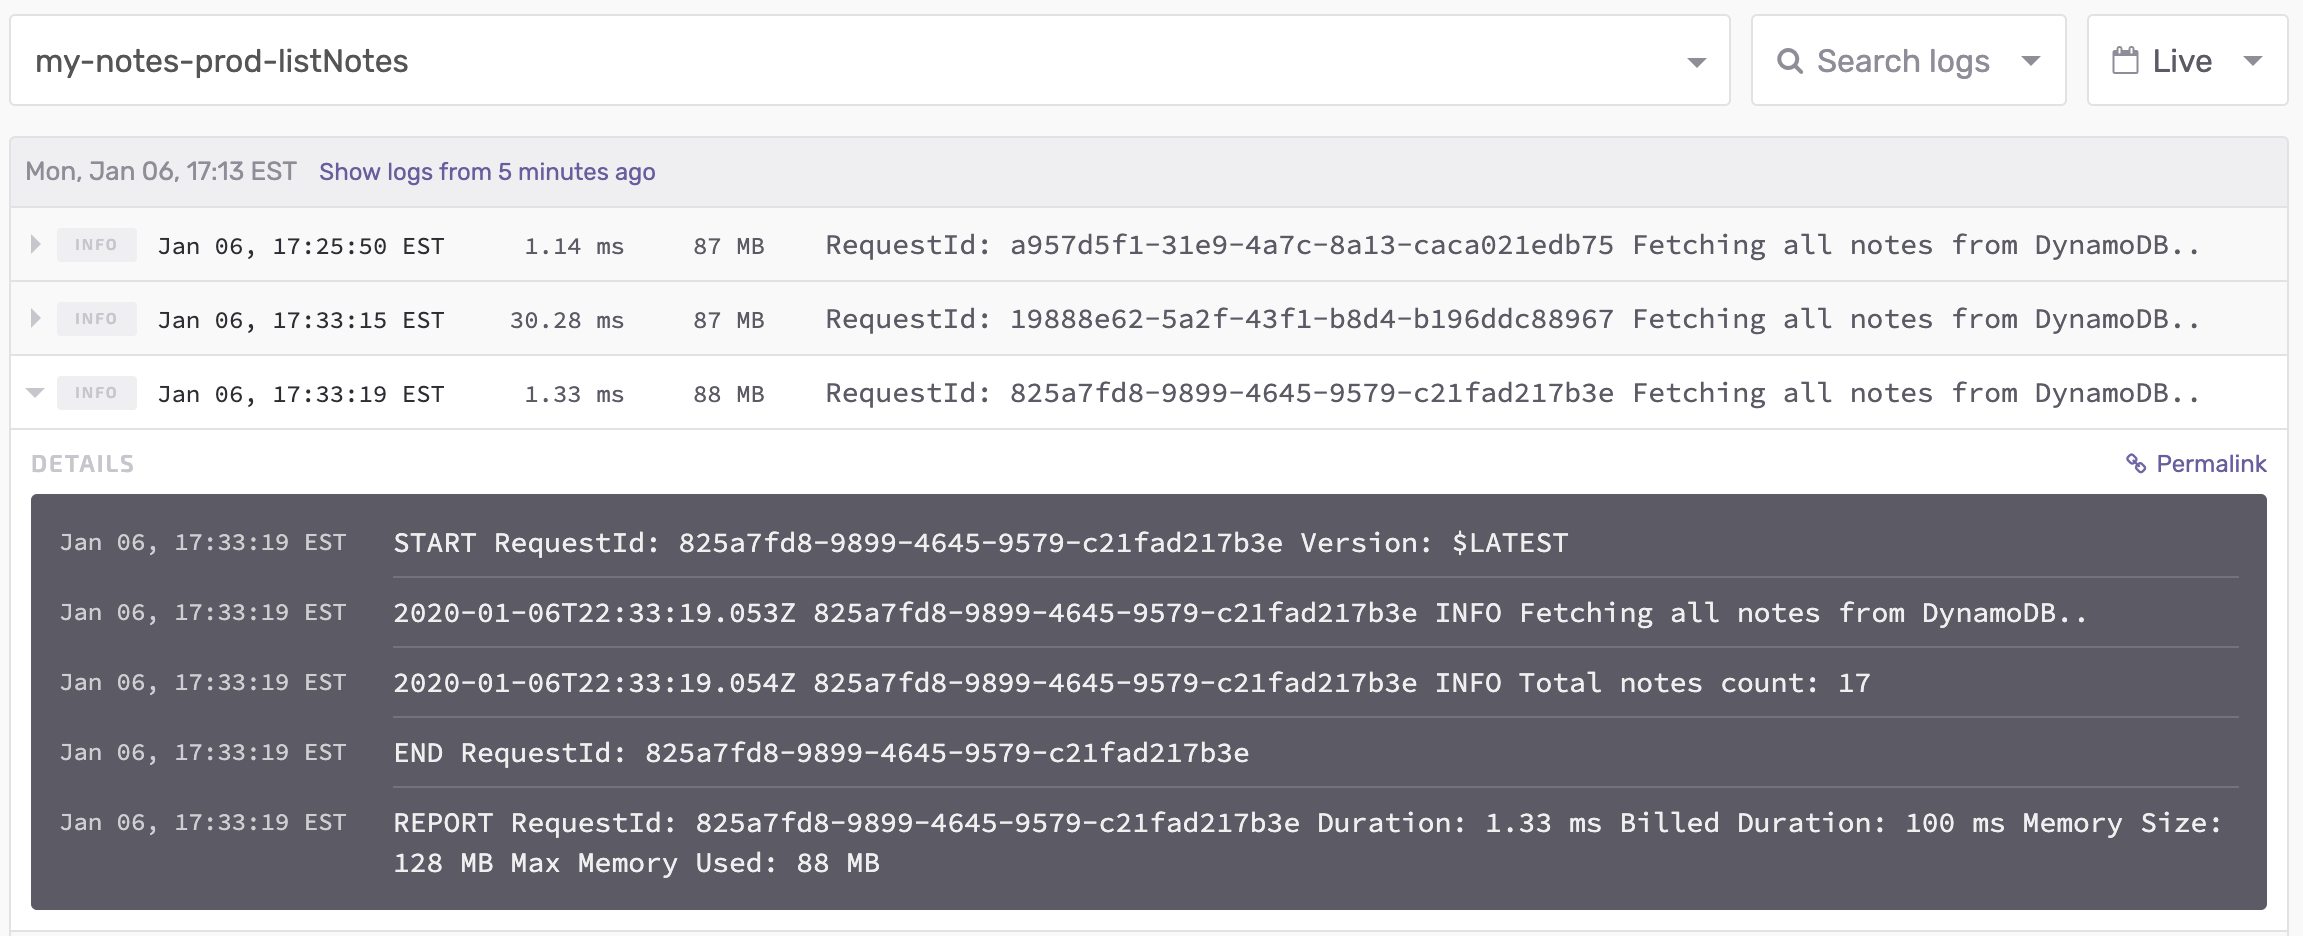
By default CloudWatch will show you a single log per line. And a few logs put together would give you a single Lambda request. Seed by default groups Lambda requests together.
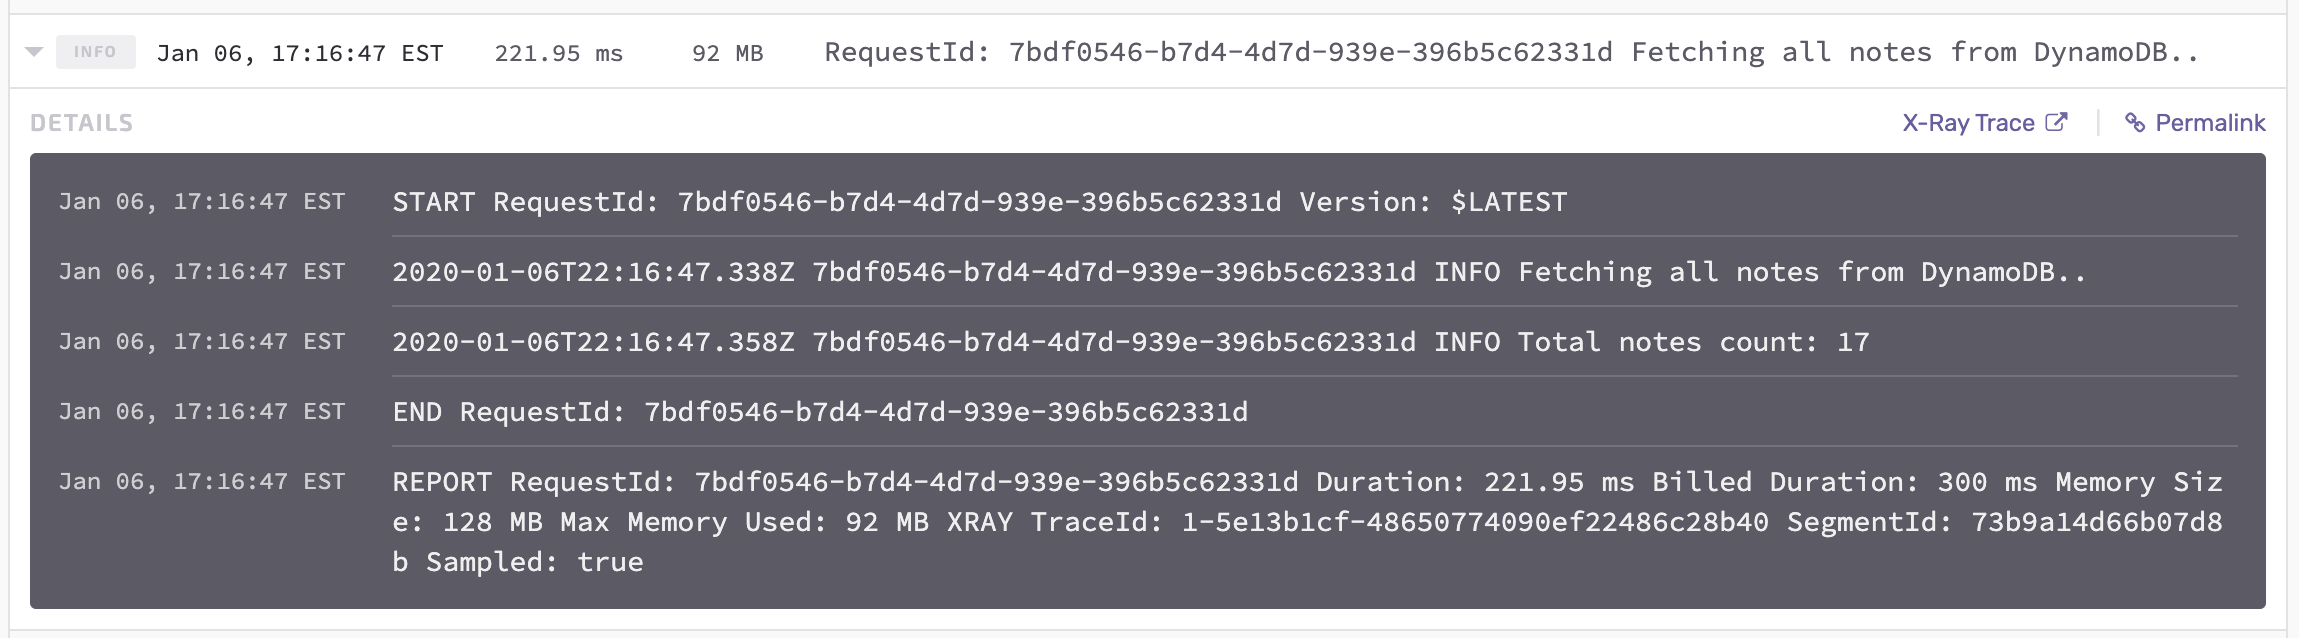
By grouping the requests together, Seed can show you all the logs related to that request. This ends up being valuable because you might be logging quite a few things in a single request.
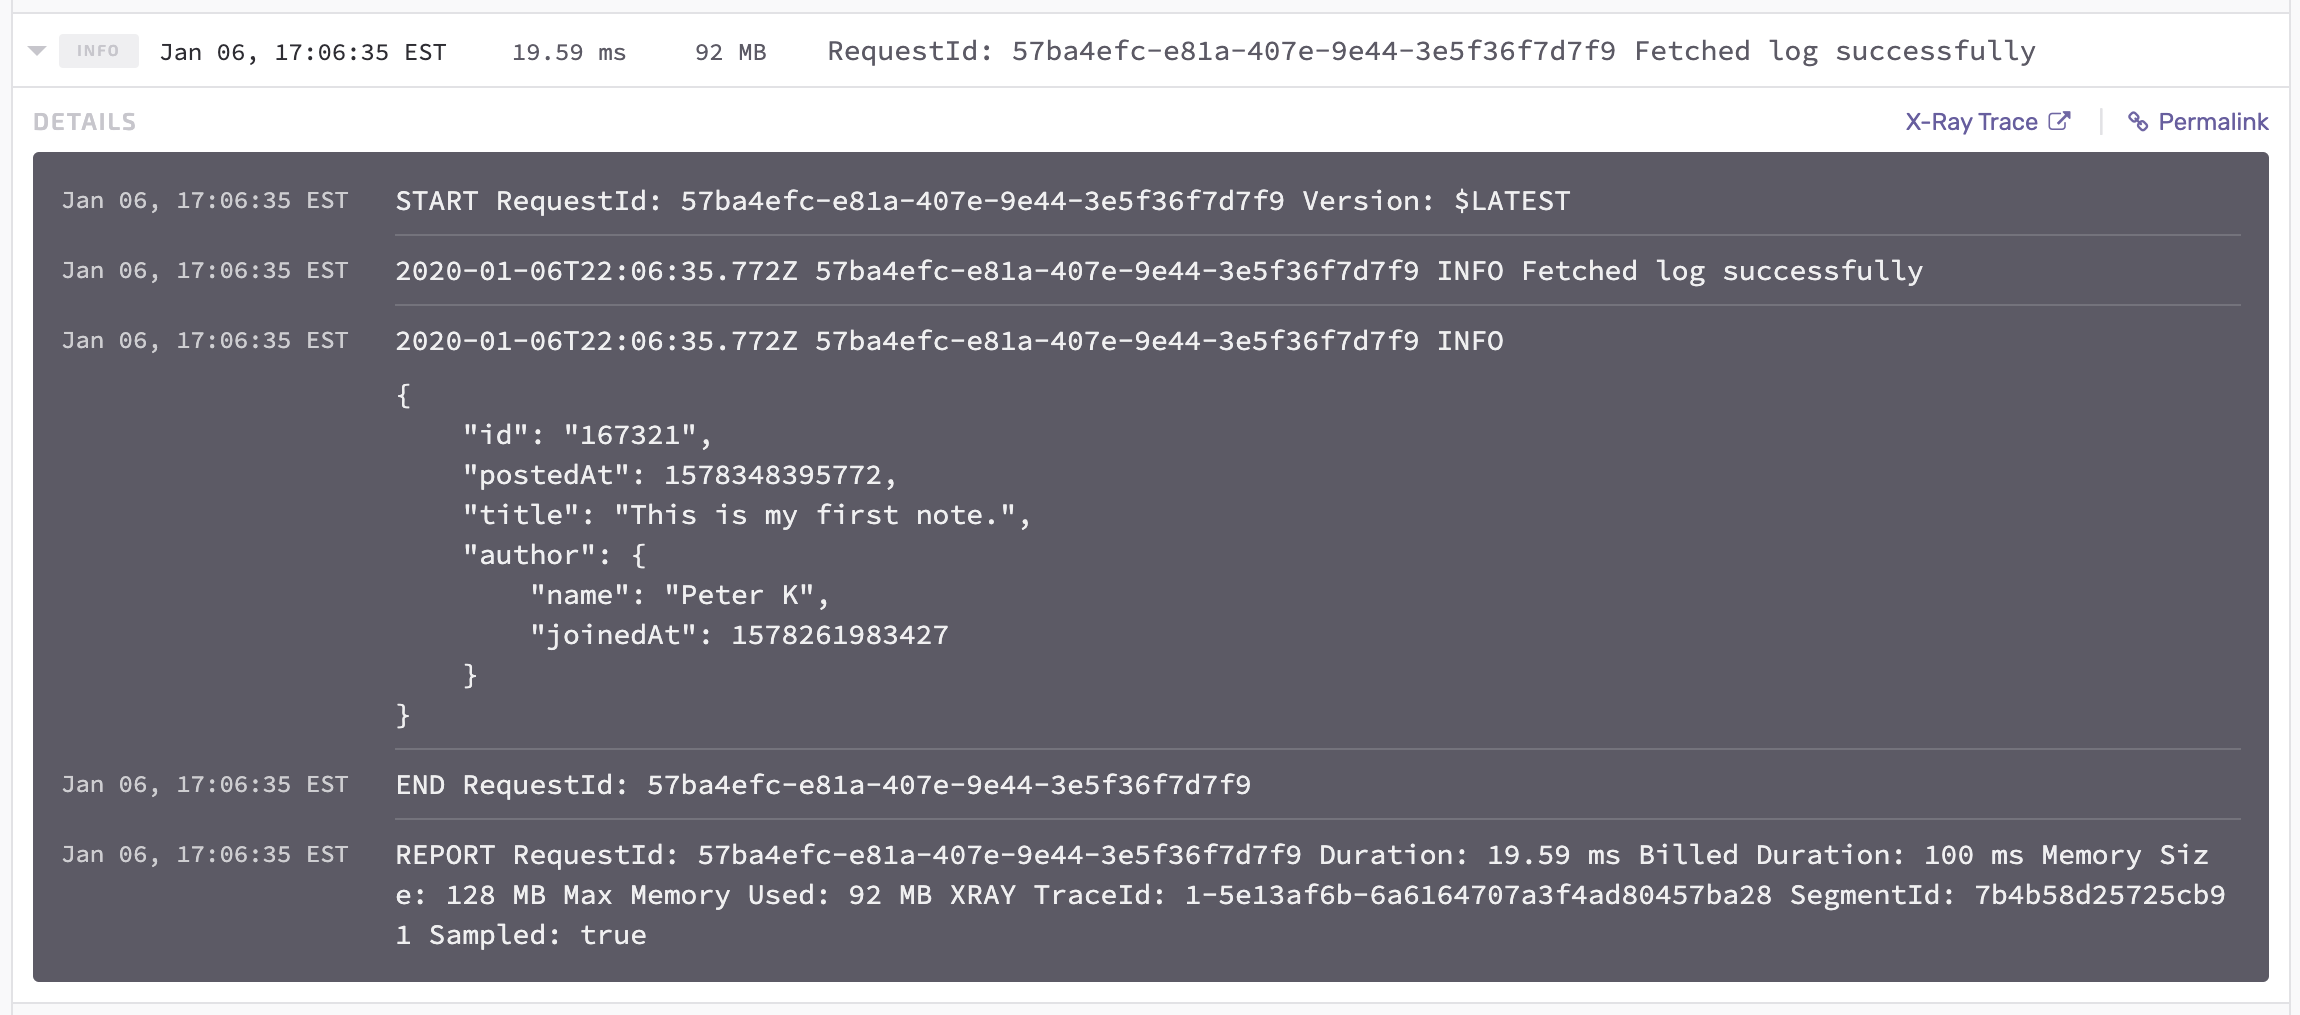
So for example, you might log a JSON object to debug what is going on in your Lambda function. Seed will automatically format this and display it alongside the rest of the request.
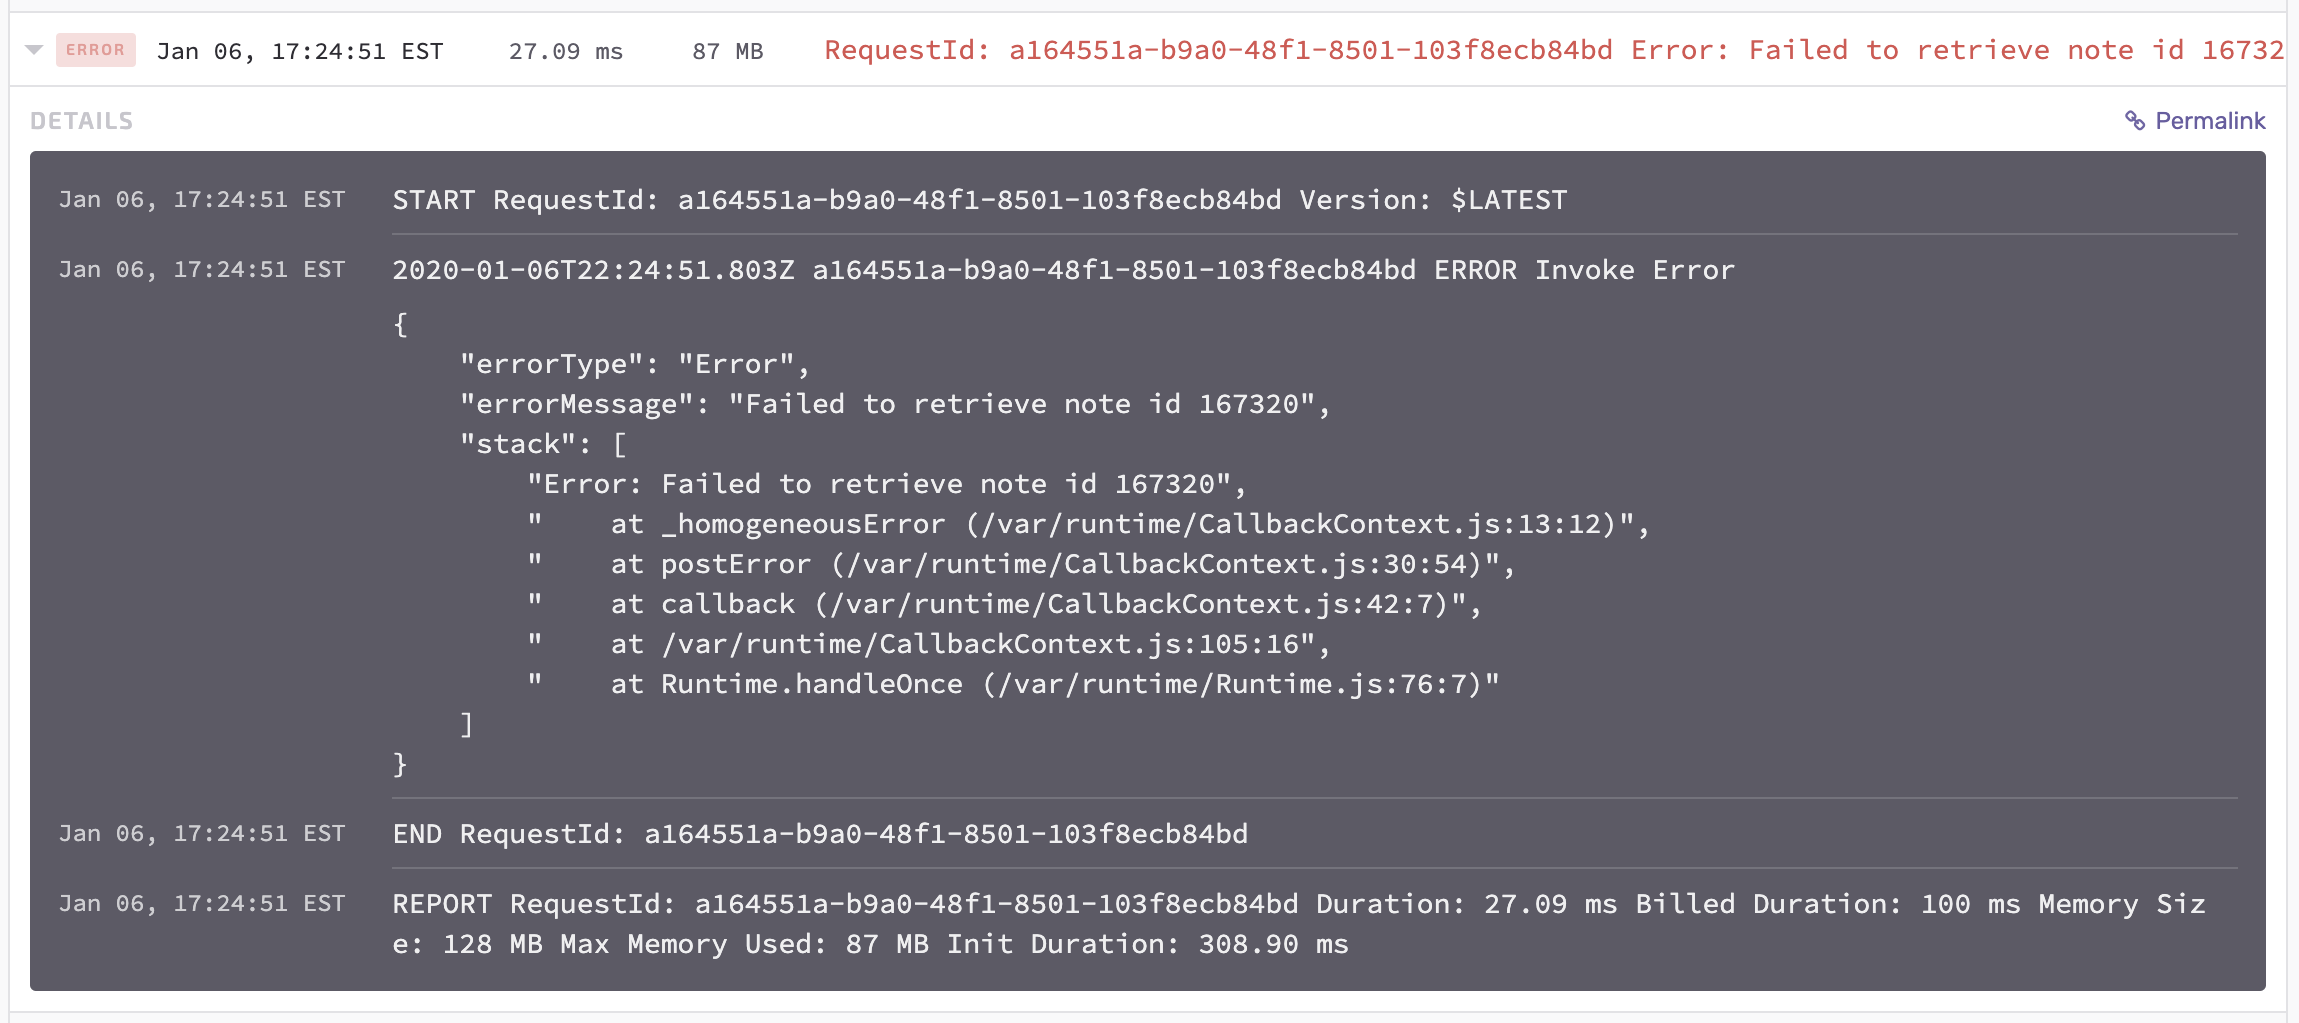
Seed will also format stack traces for you.
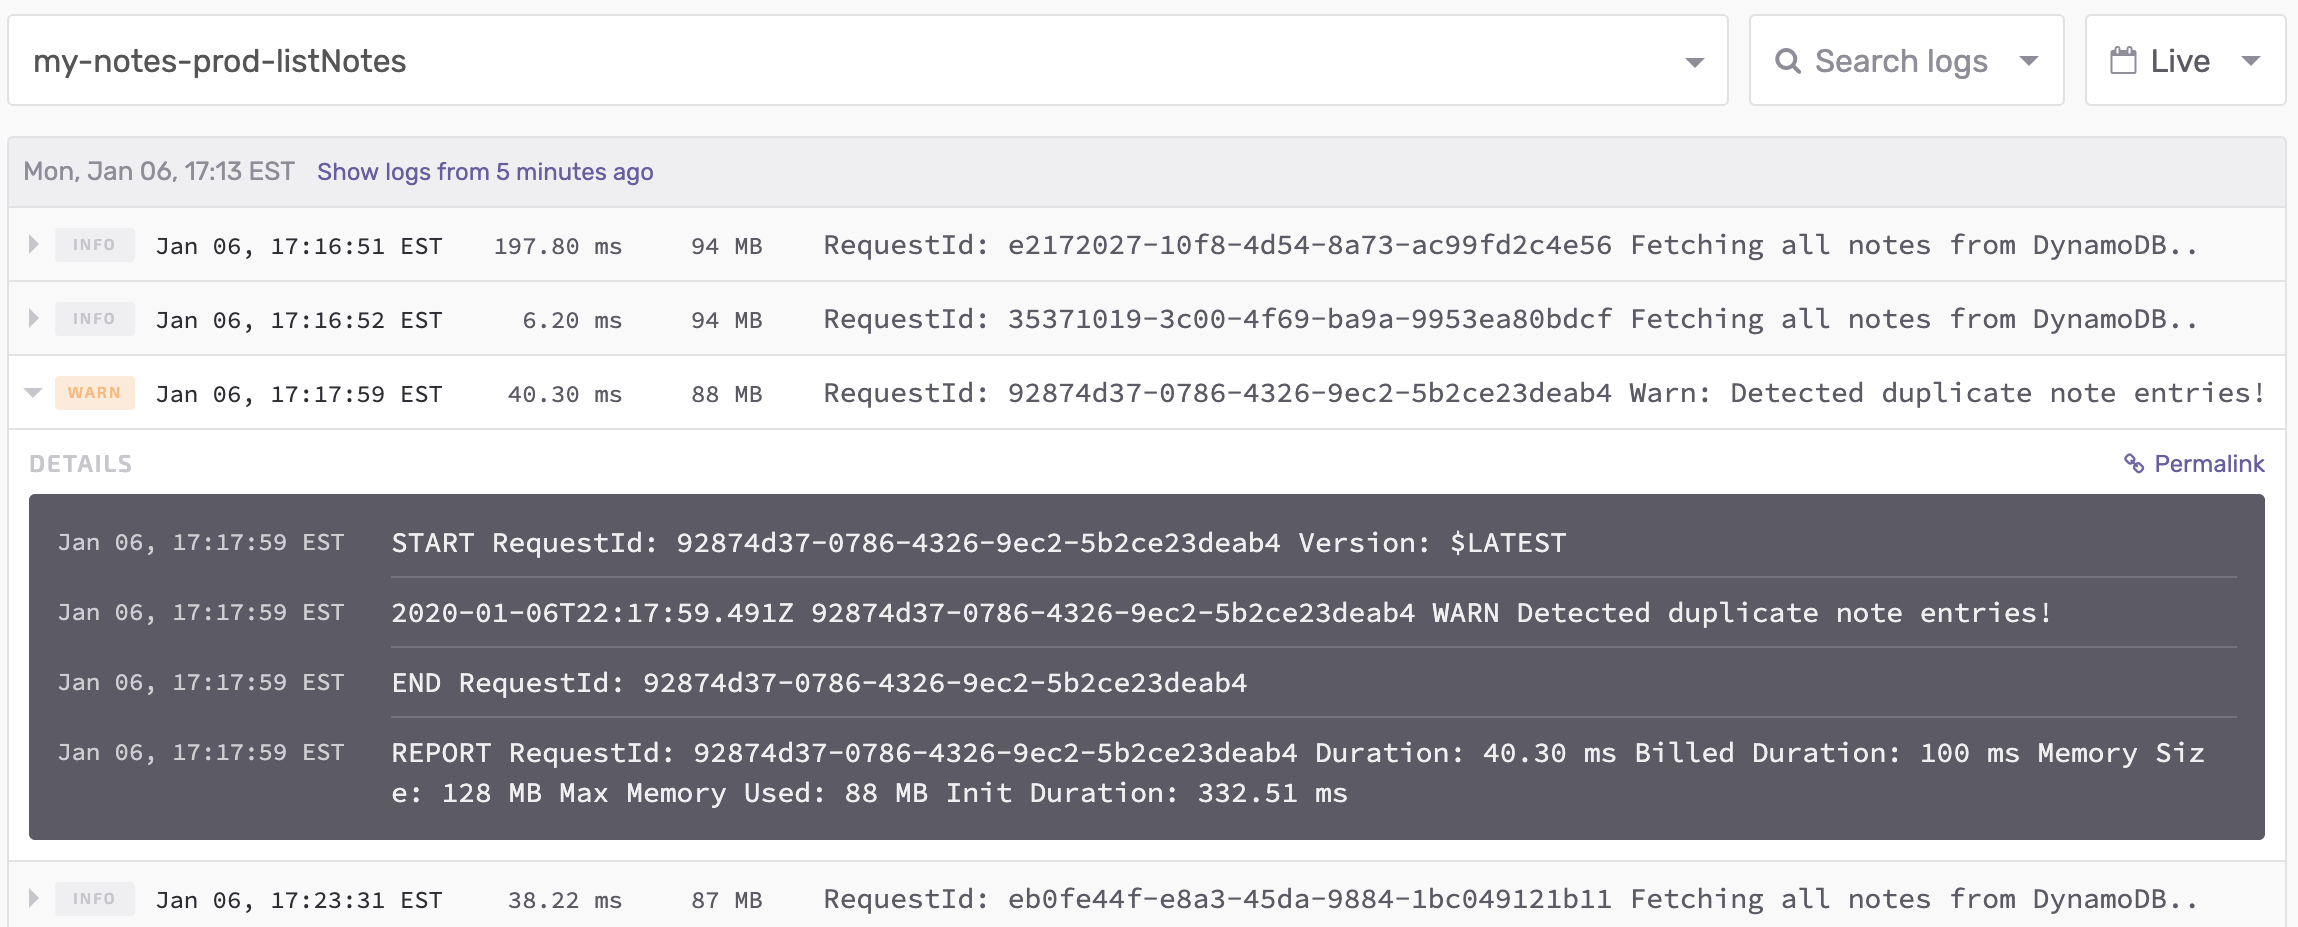
Lambda logs errors and warnings
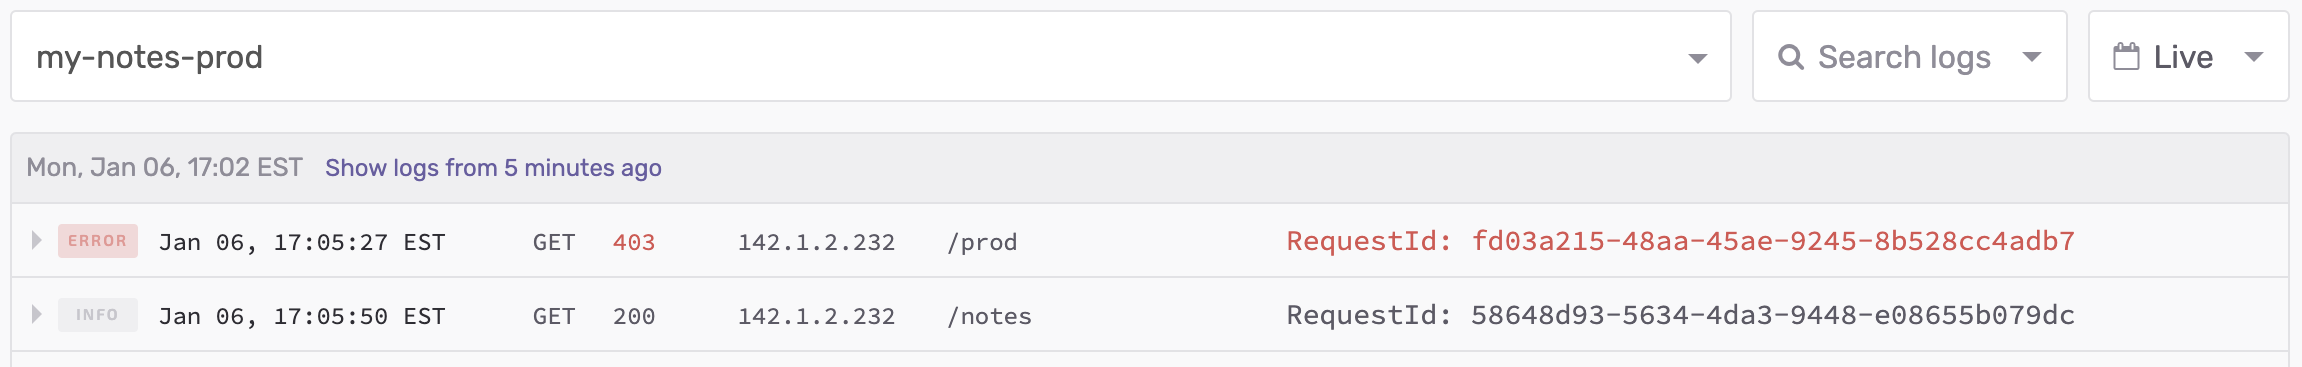
Seed will highlight any Lambda errors. This makes it really easy to scan through your logs and identify the ones that are causing a problem.
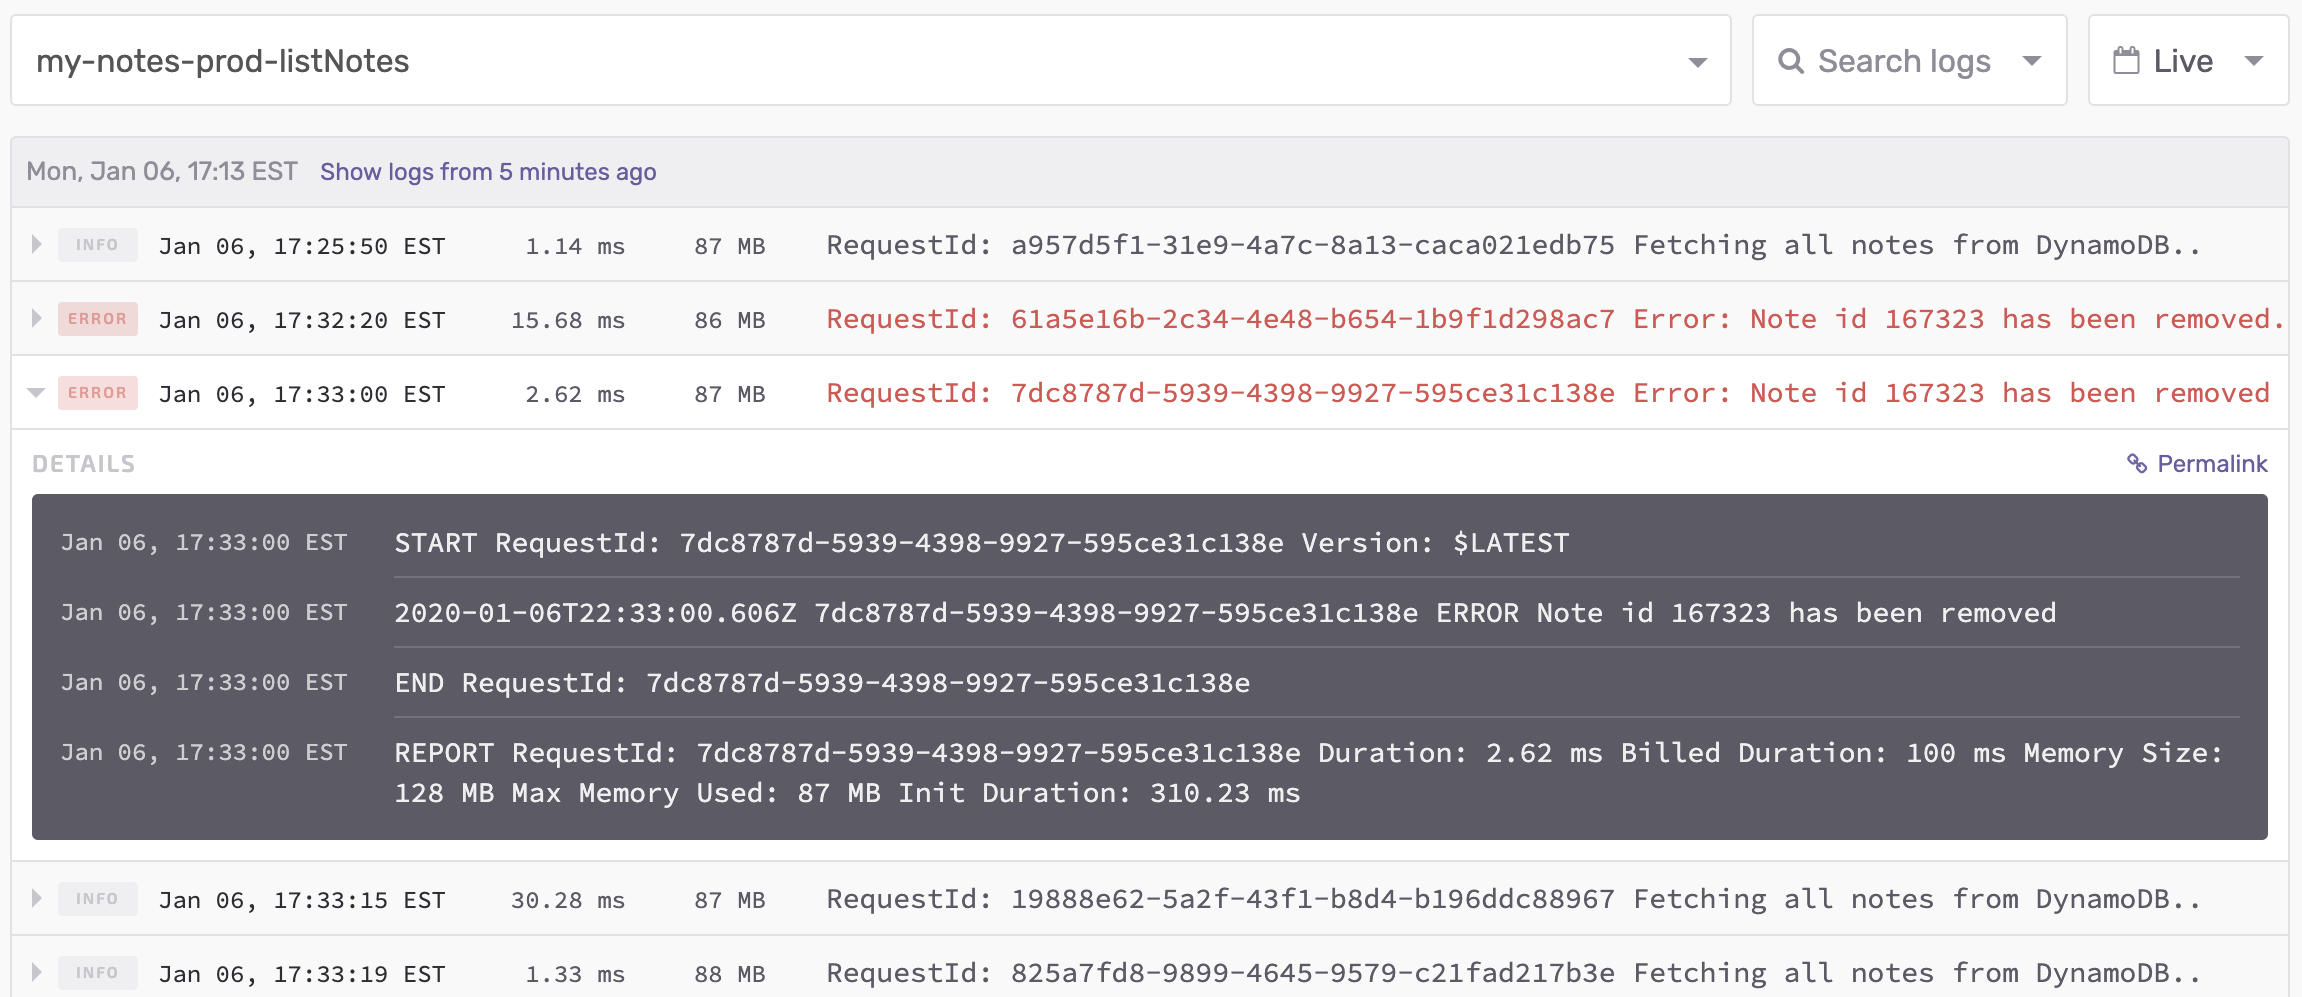
In Node.js anything you logged using console.error will also get highlighted. While, the console.warn gets highlighted as a warning.
Sharing logs
The automatic grouping of Lambda log requests allows us to fix one of the biggest issues of working with logs, sharing log with your team!
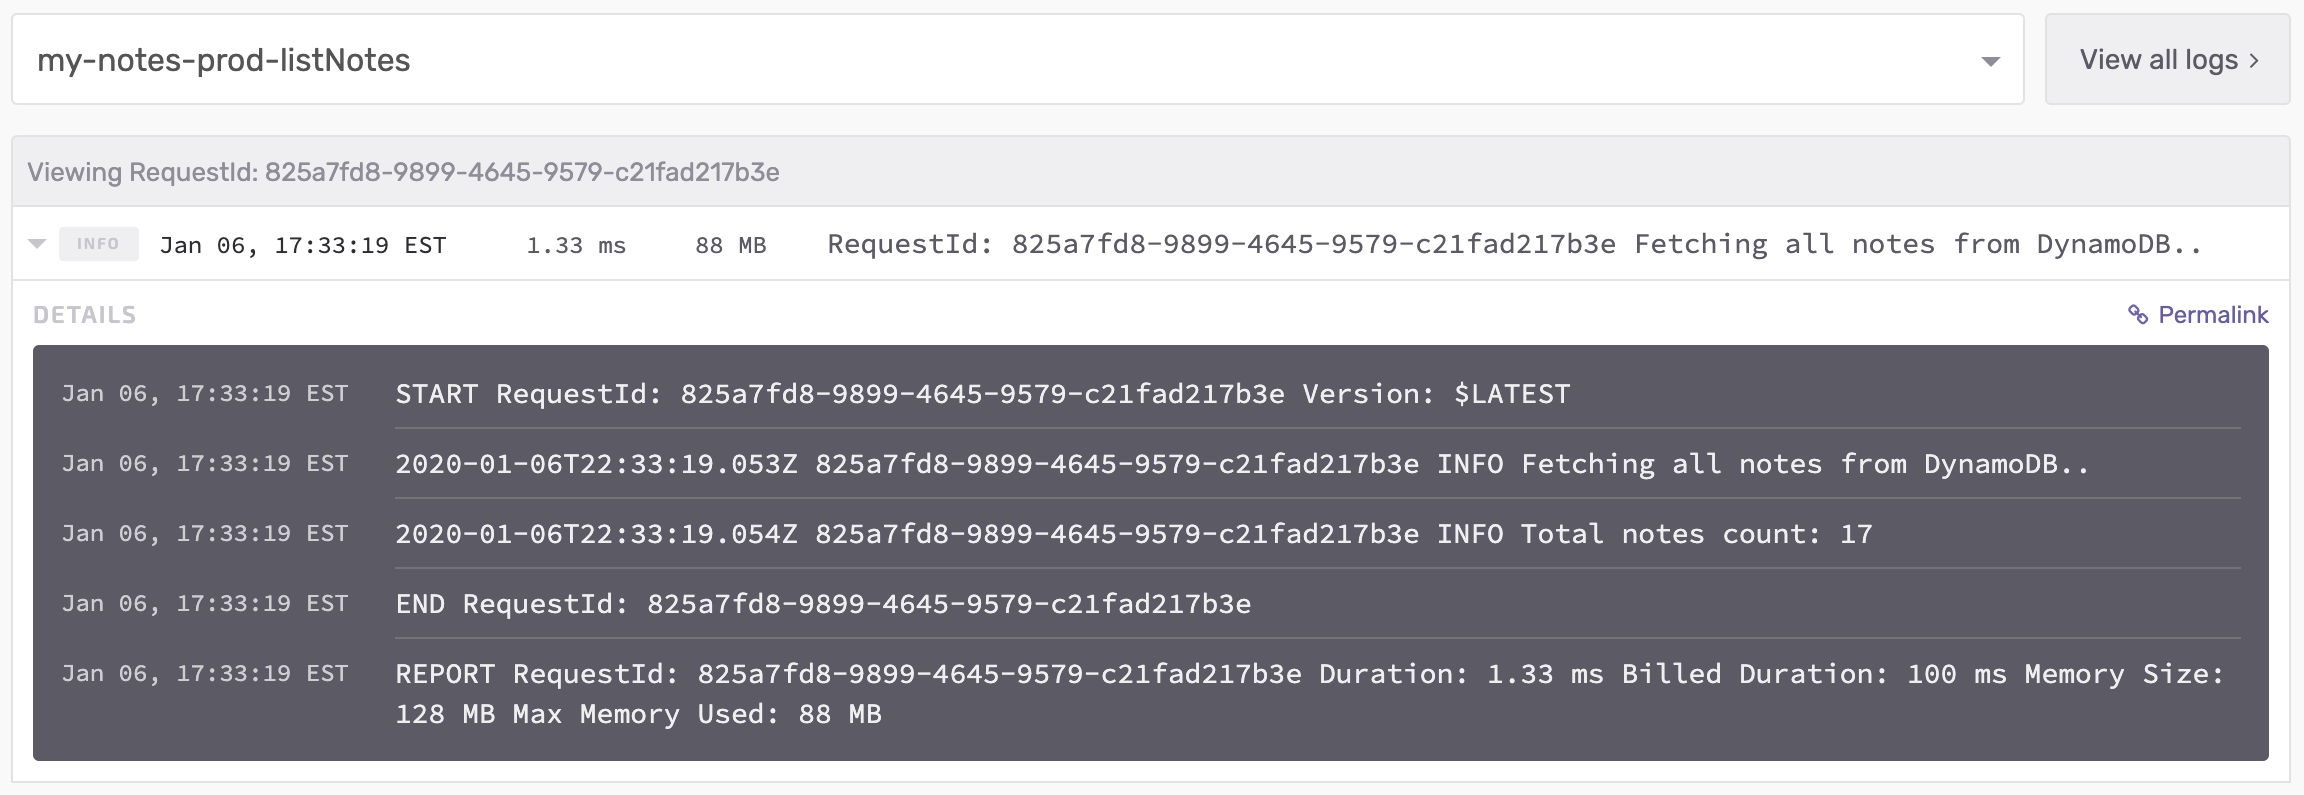
Lambda requests (and API Gateway access logs) comes with a permalink that you can share with anybody on your team.
This is almost indispensable when working within a team. Once you finally track down that pesky issue through the logs, you’ll have a permalink that you can share with your co-workers.
AWS X-Ray Trace
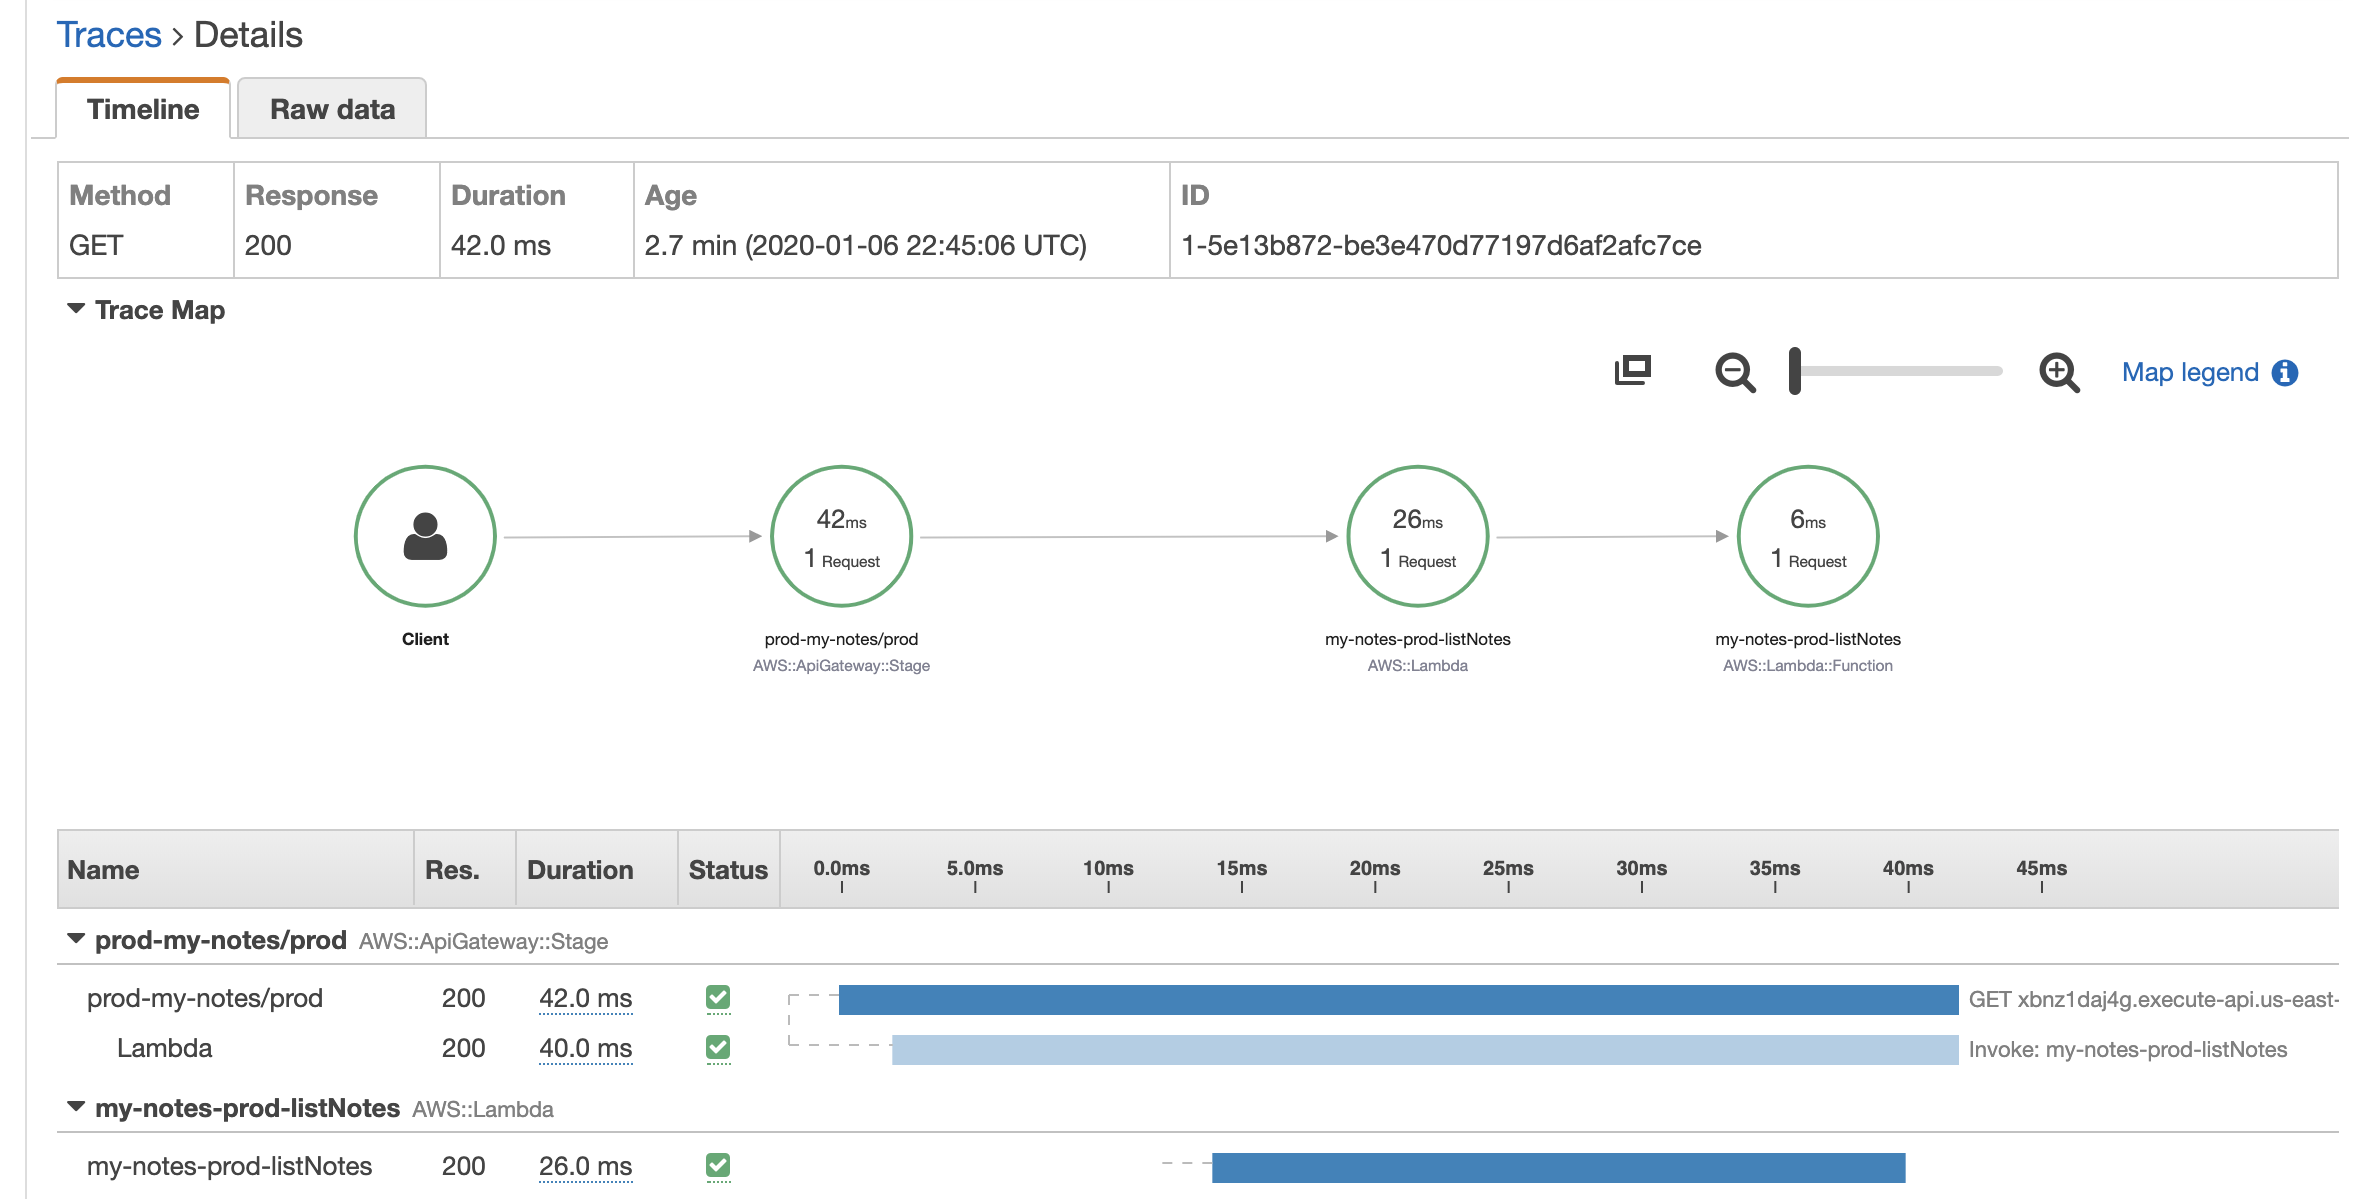
If you have AWS X-Ray enabled for your Lambda functions, Seed will show you a direct link to the trace for that Lambda request.
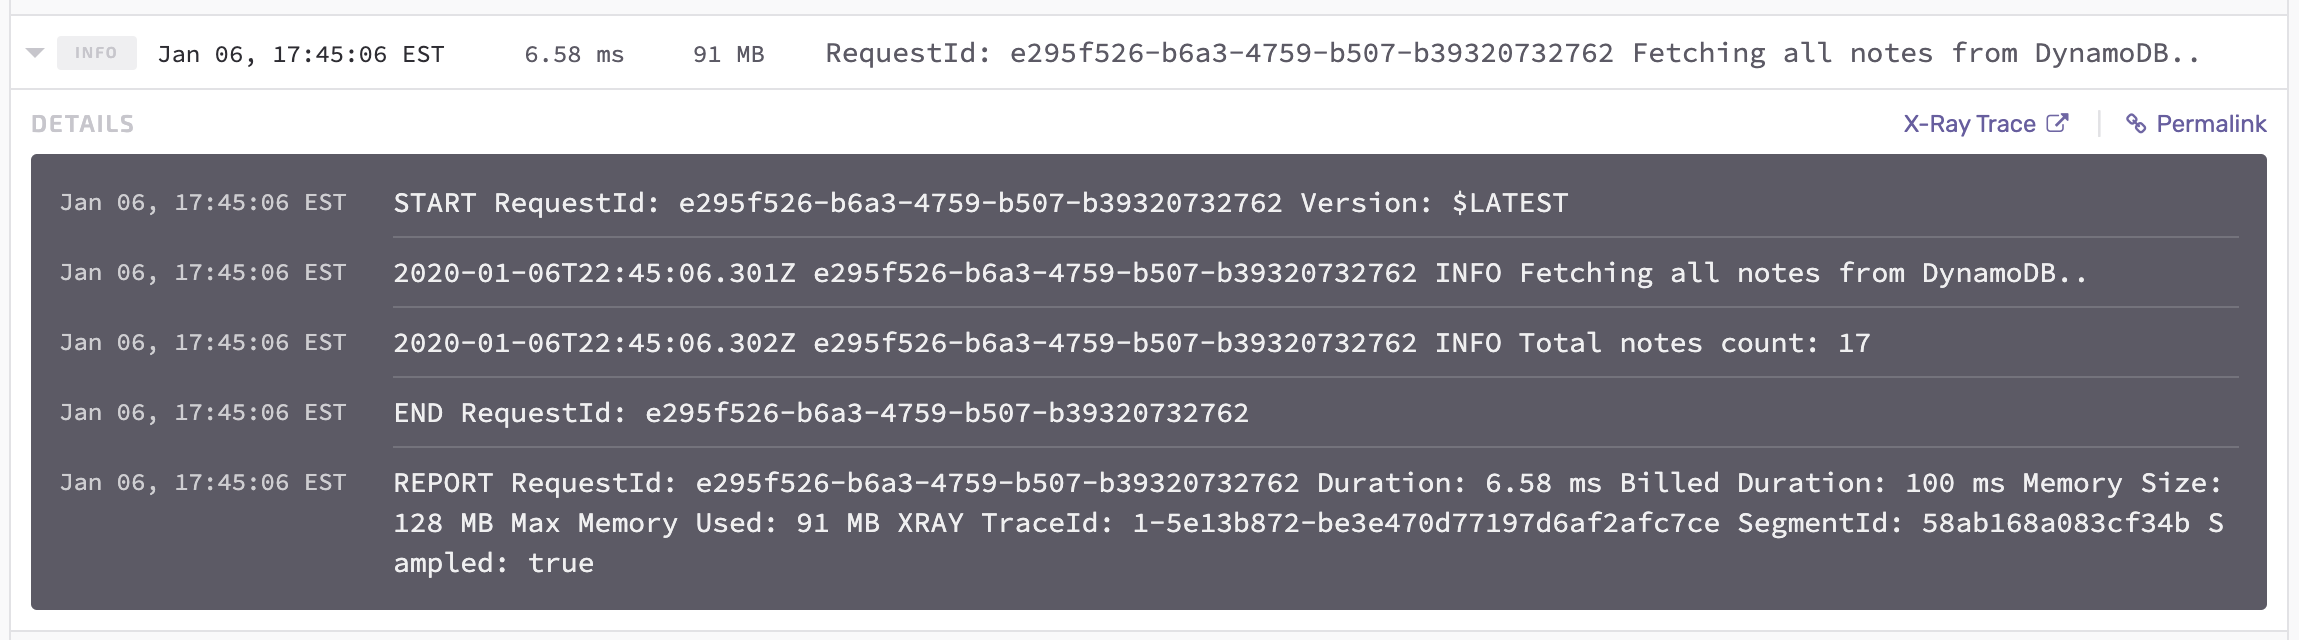
Simply, click through to view the X-Ray trace over on your AWS Console.
API Gateway Access Logs
In your Serverless app, you want to make sure to enable access logs. It’s a great spot to start debugging any issues. Seed will neatly format all the fields that are being logged as a part of your access log.
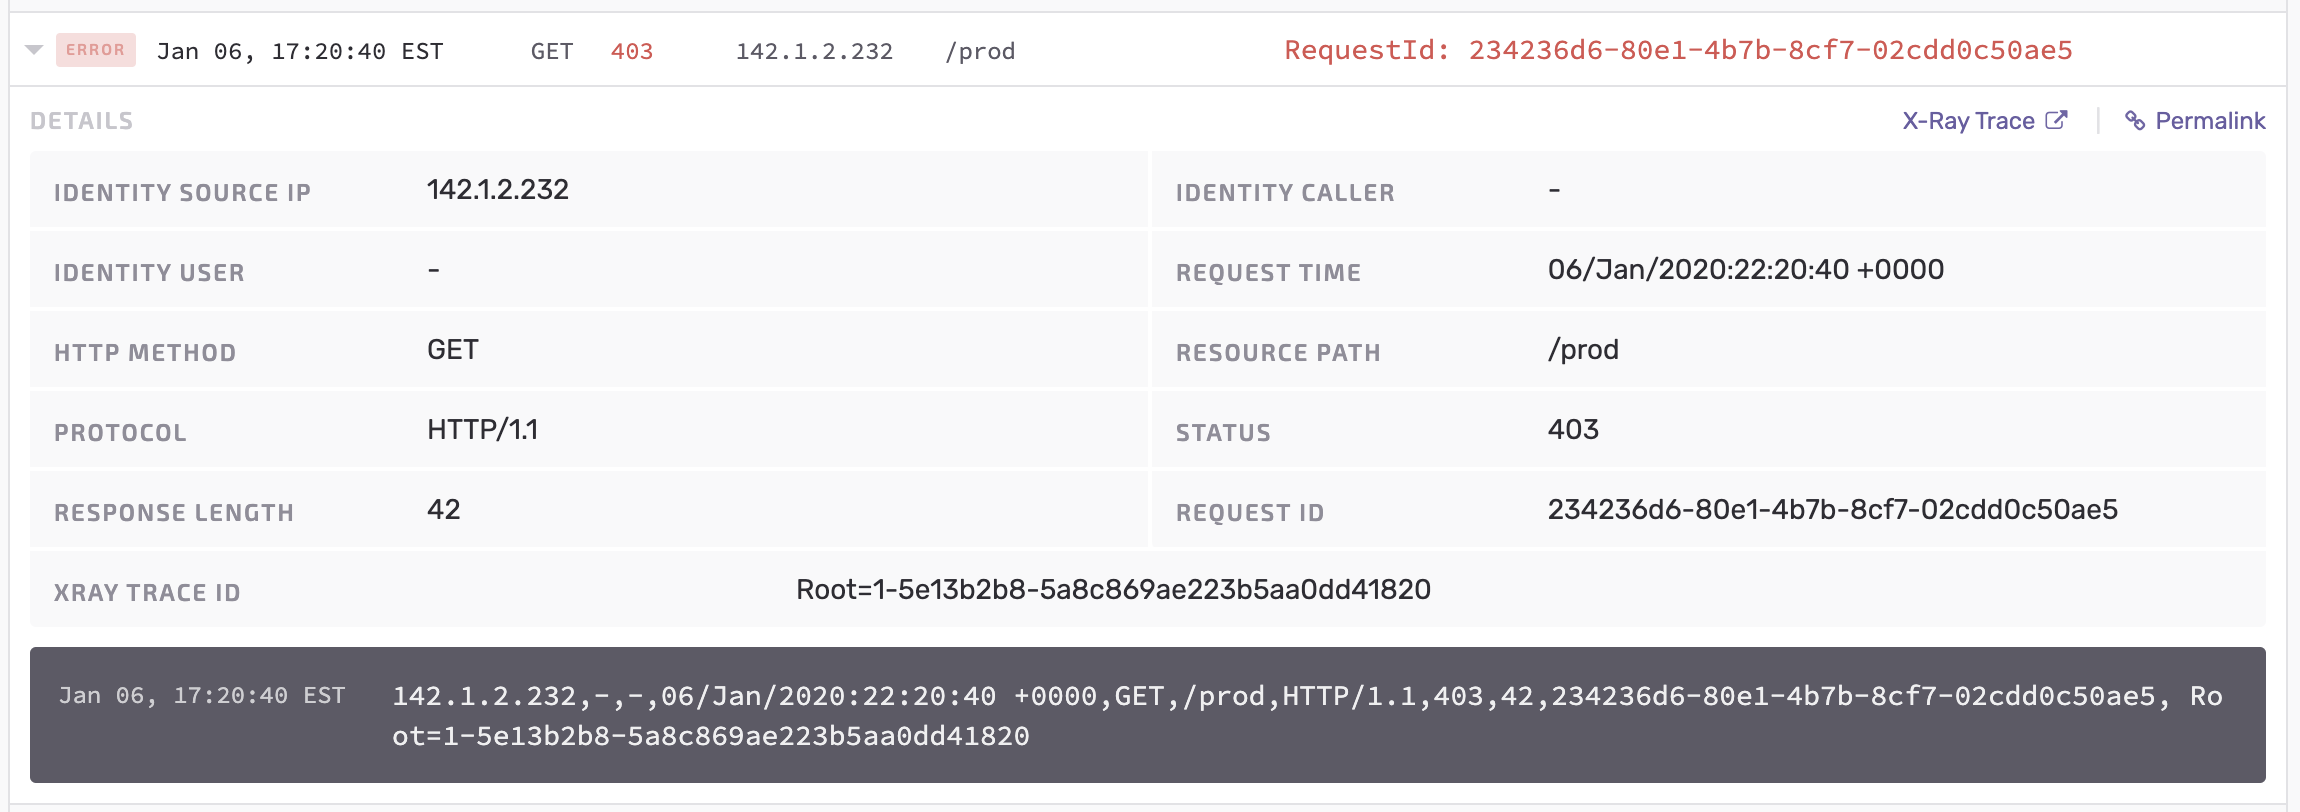
And just as Lambda logs above, access logs with errors get highlighted.
Filter by time
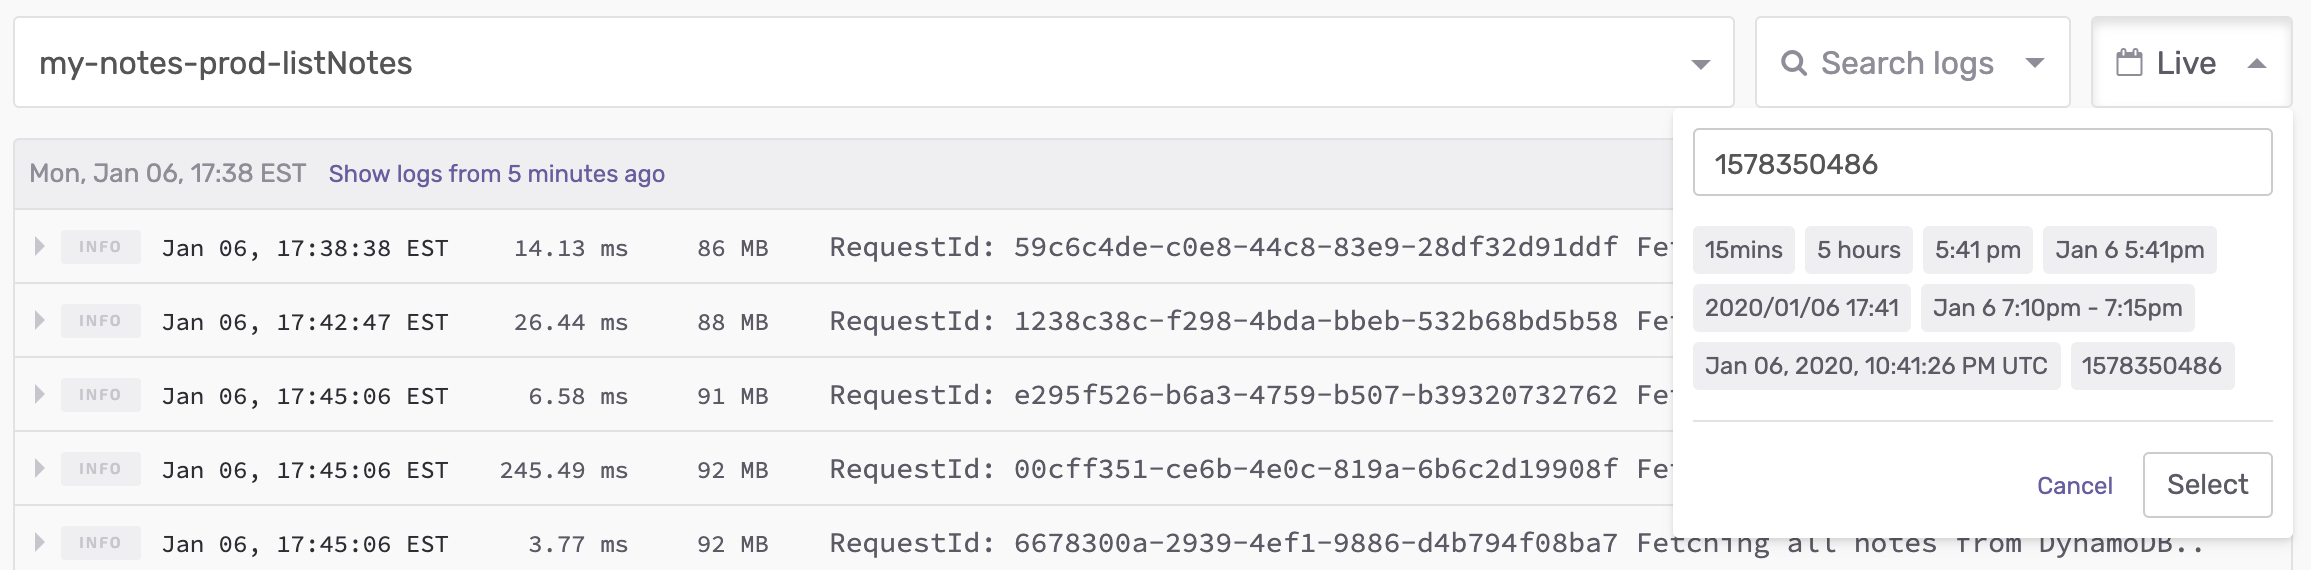
Seed also makes it really easy to look up logs around a specific date and time. We’ve taken extra care to support some key use cases.
For example, you might have received an alert for an error and want to check the logs for it. You can easily look up the logs from the past few minutes.

We also support a variety of date and time formats. Including ones with an explicit UTC timezone. This is typically what you might receive from other error reporting services, like Sentry.
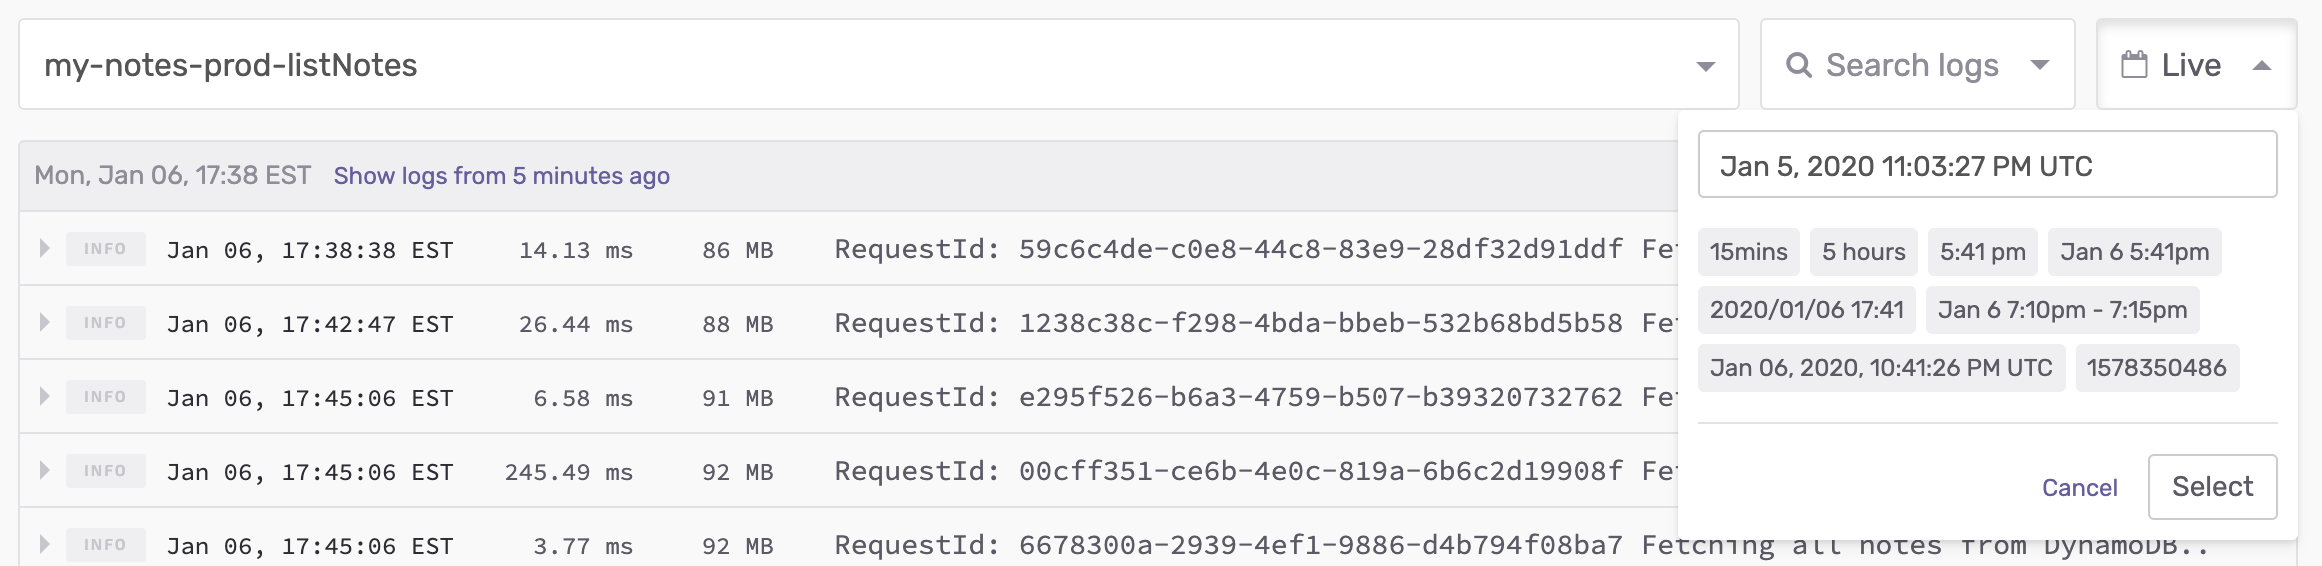
You can also use a Unix timestamp.
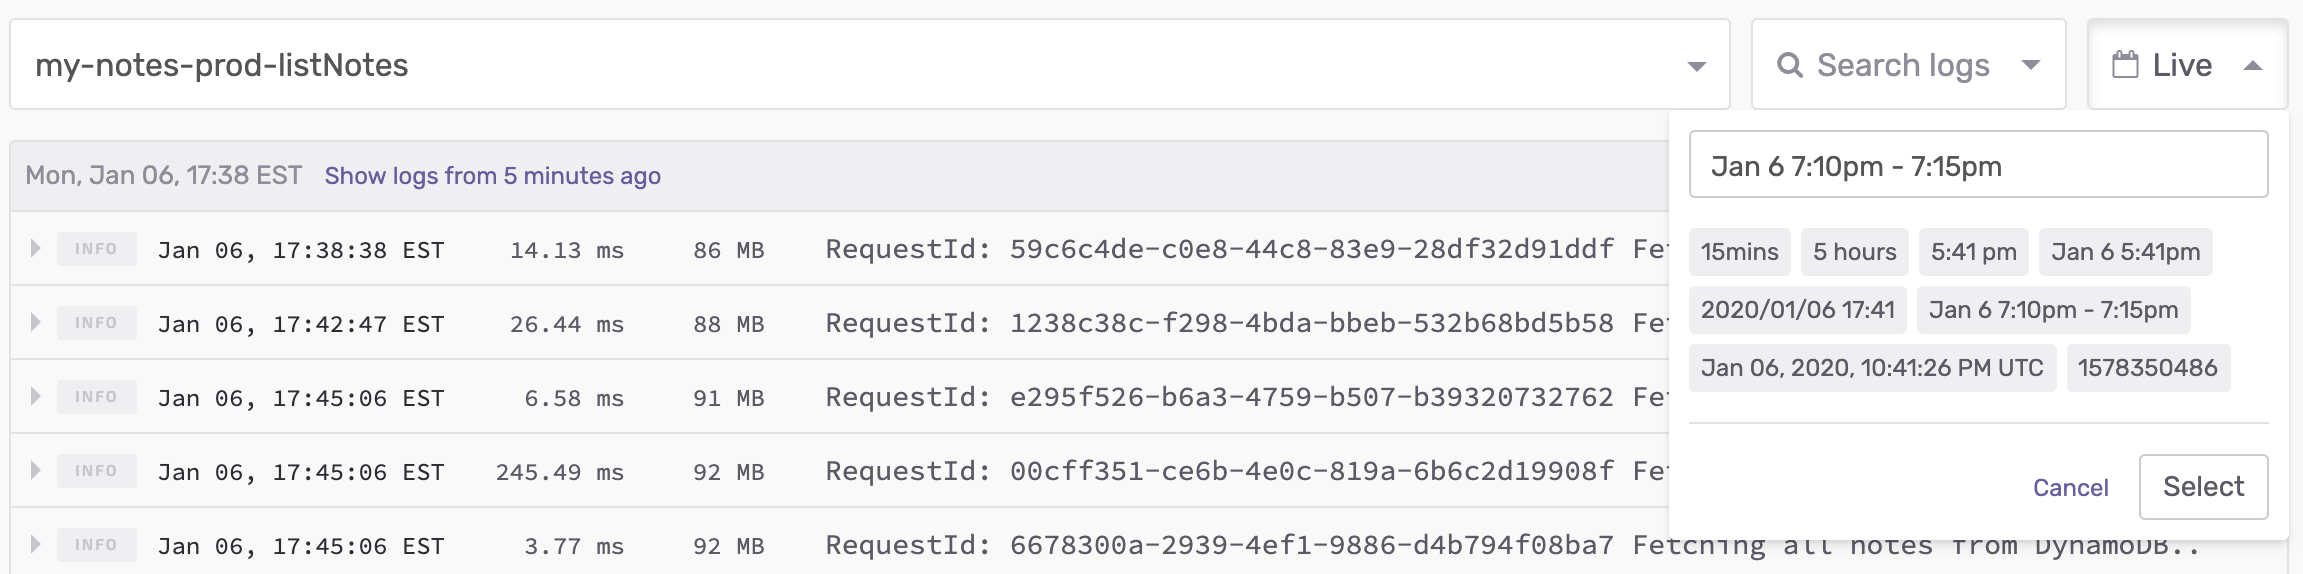
And finally, look up logs within a given time range.
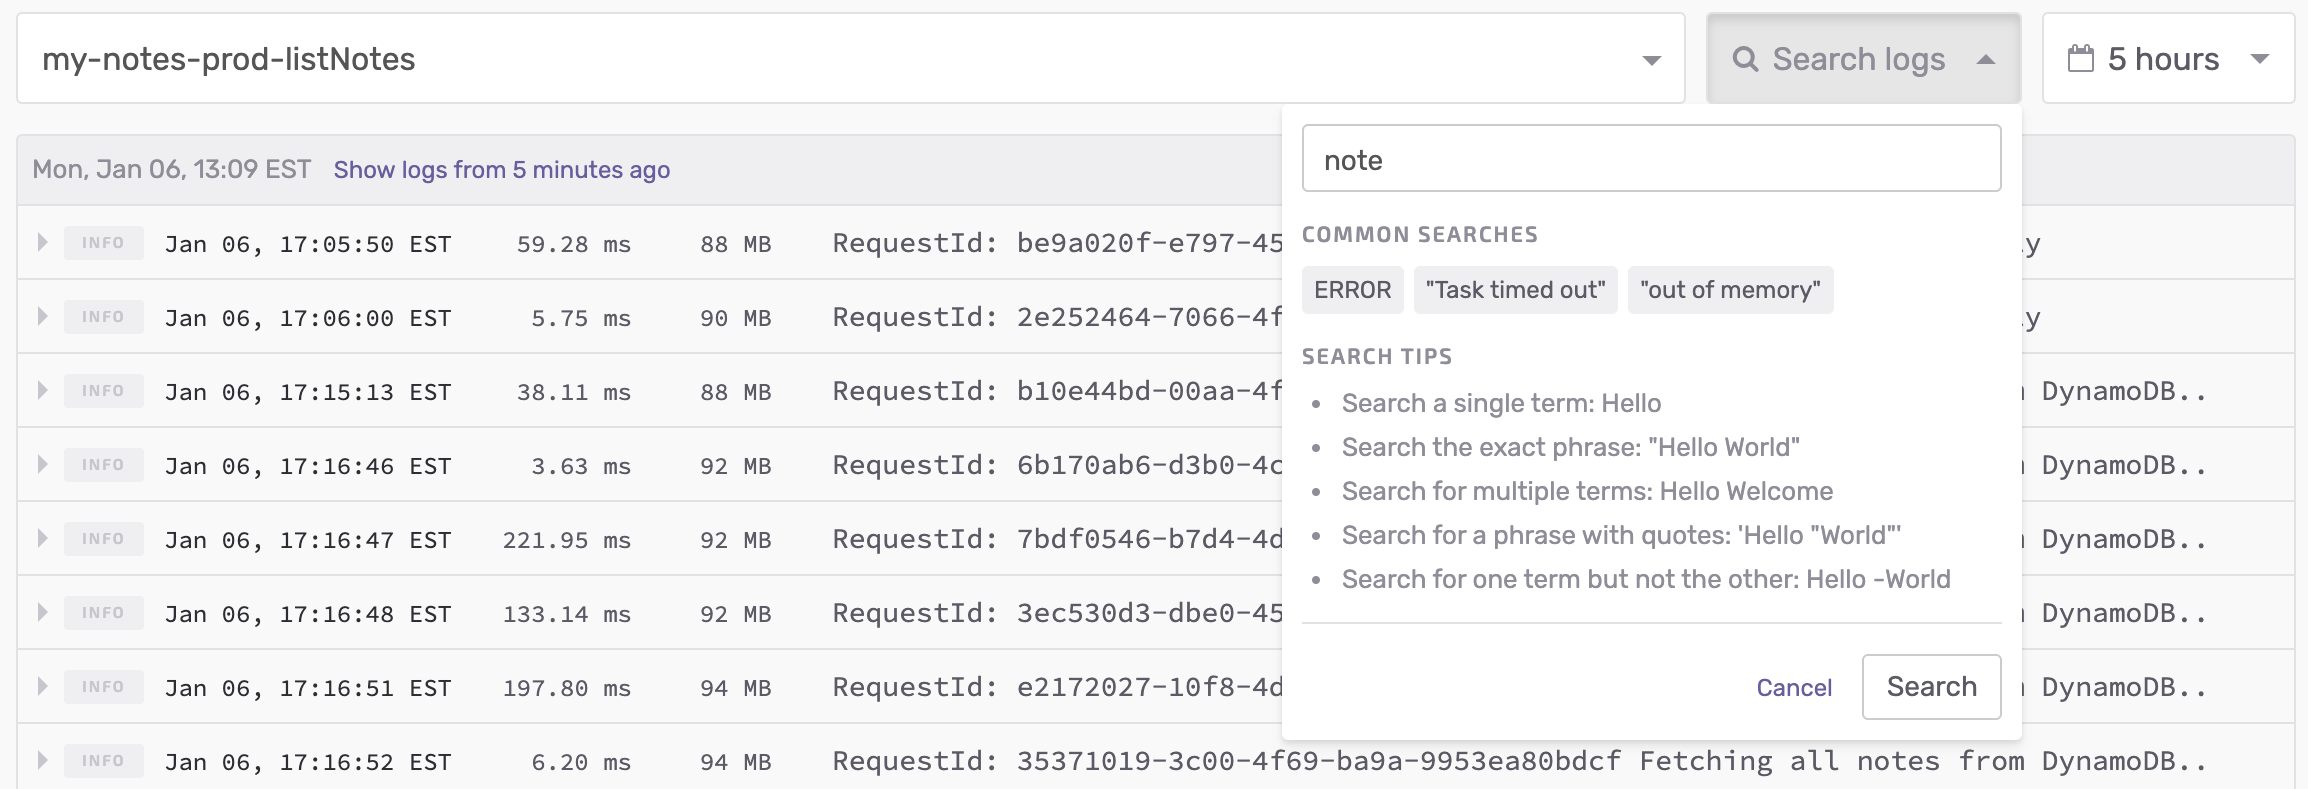
Filter by search terms
You can filter logs with a variety of search terms. For example, you can search for a single term.
You can search for a phrase using quotes.
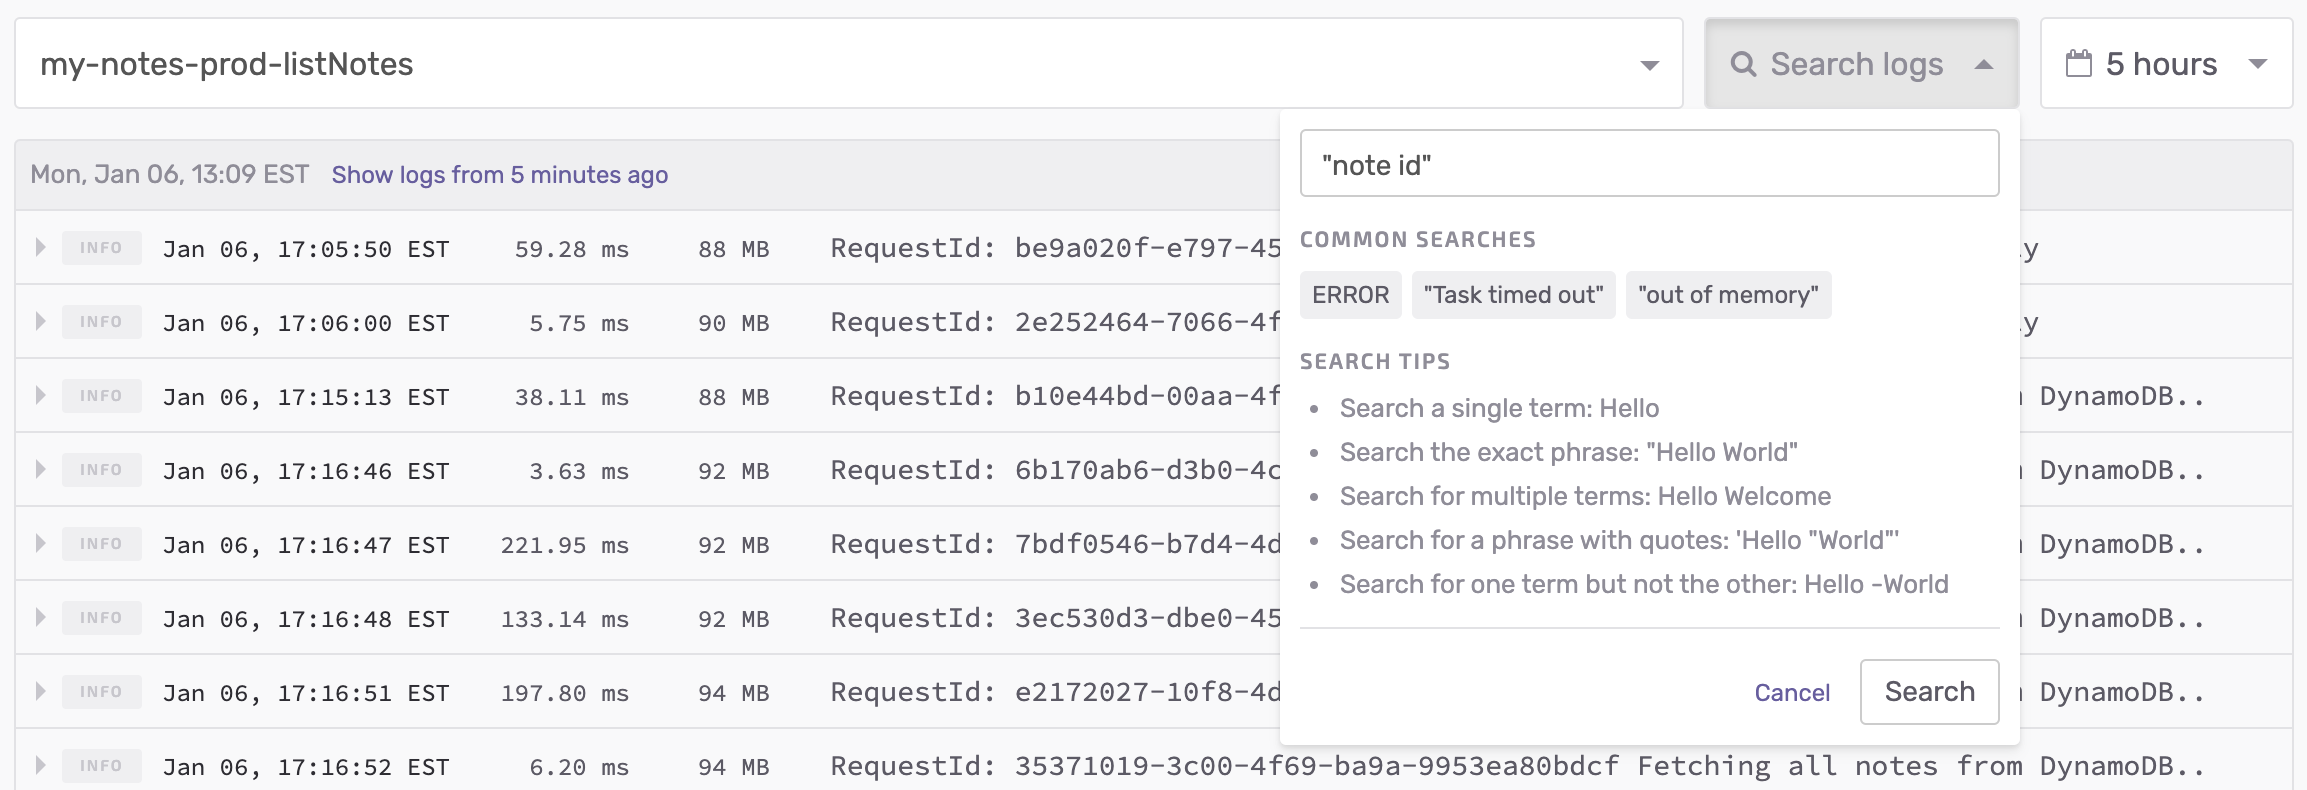
Or search for multiple terms or phrases.
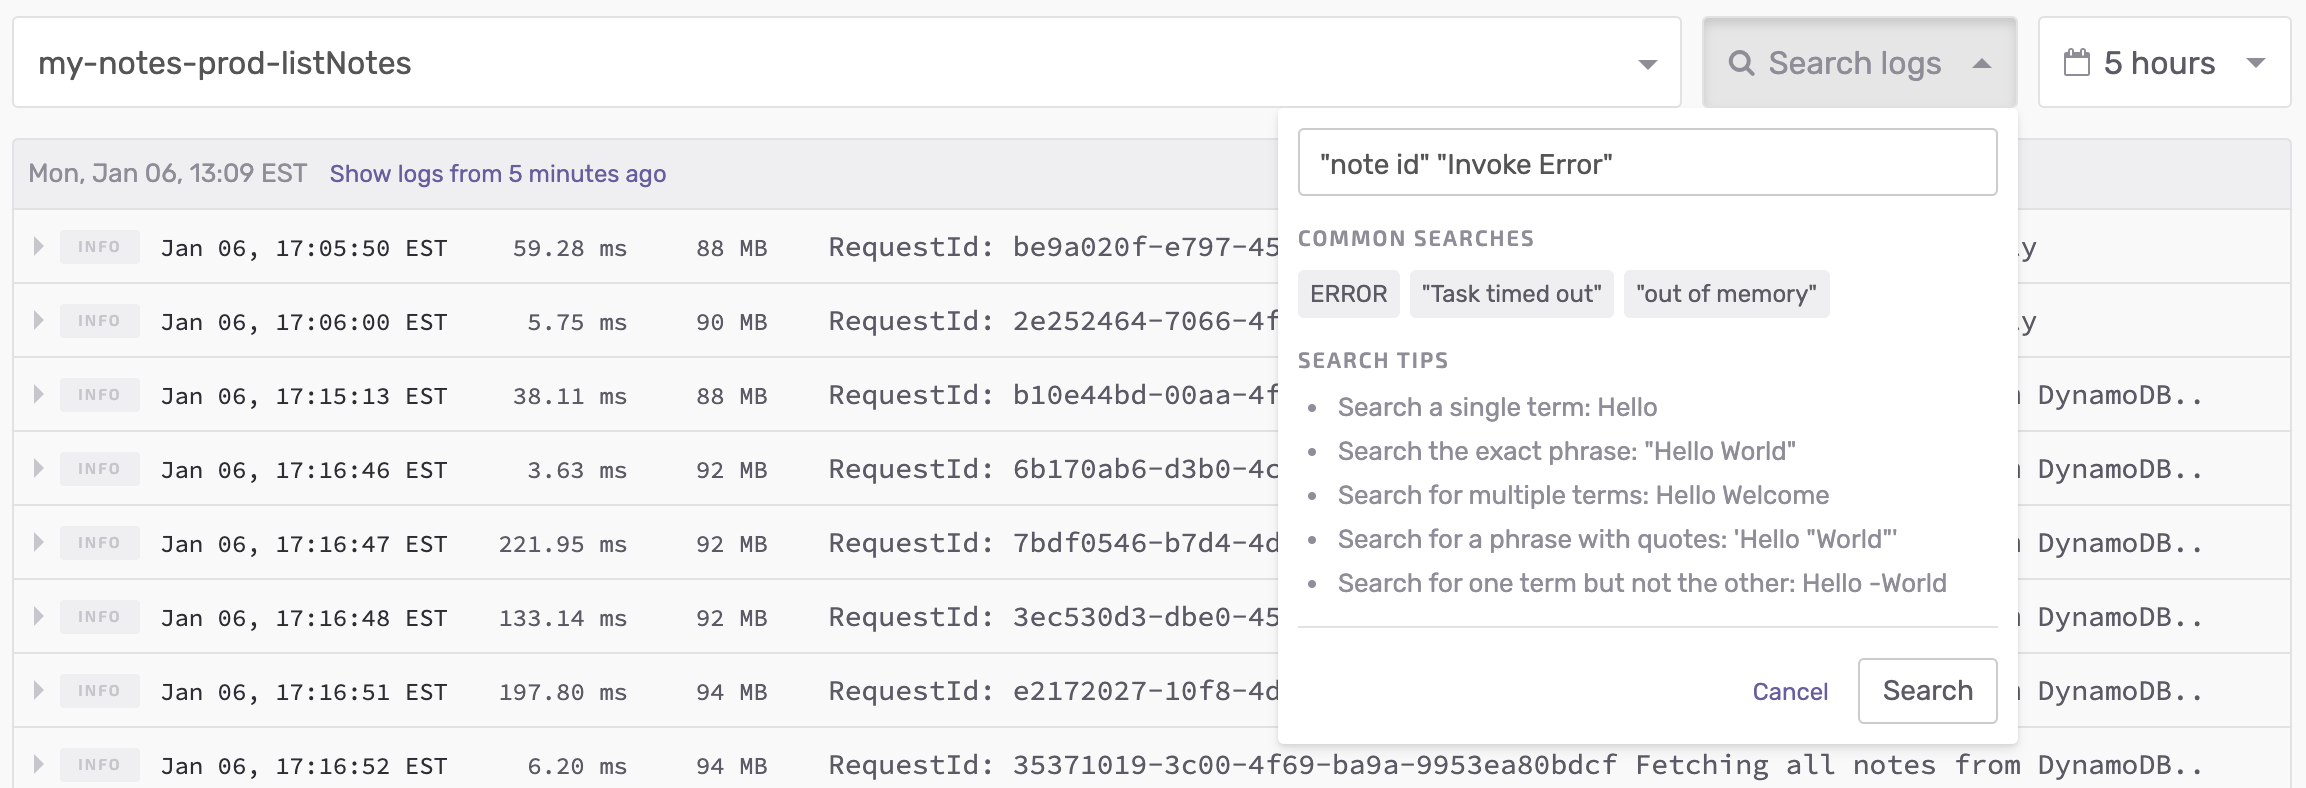
You can even exclude certain terms in your search.
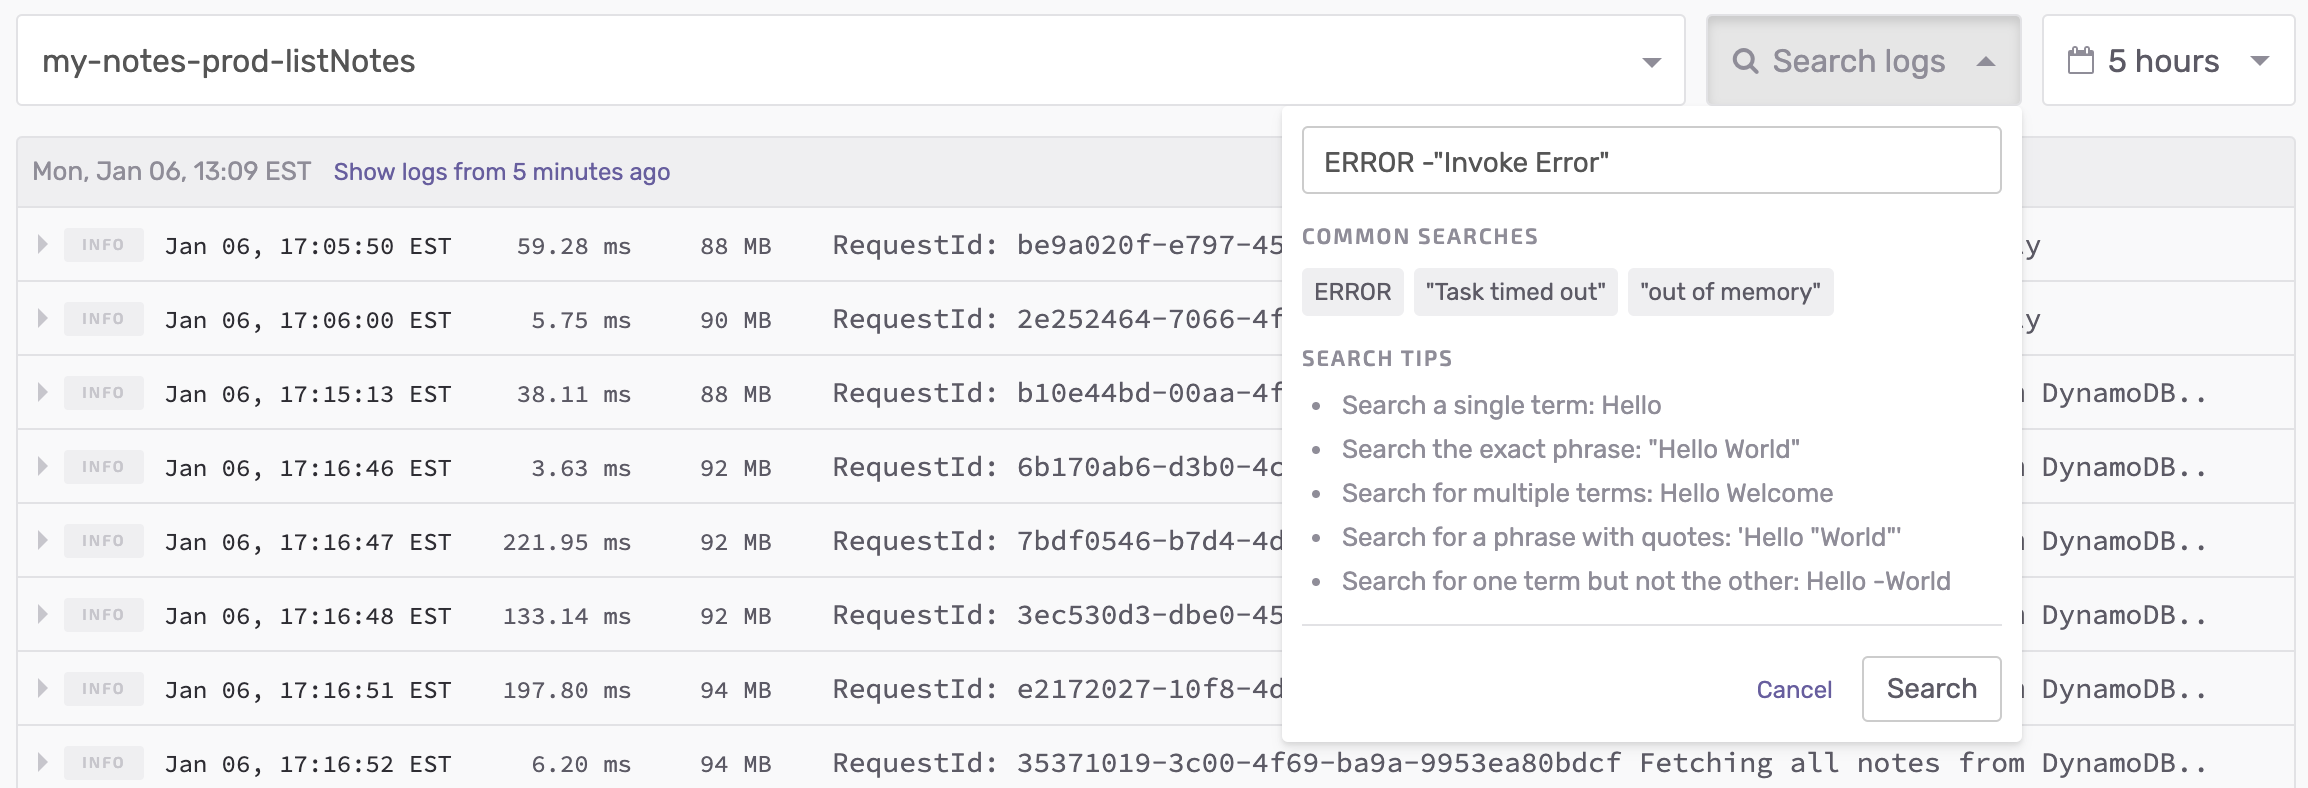
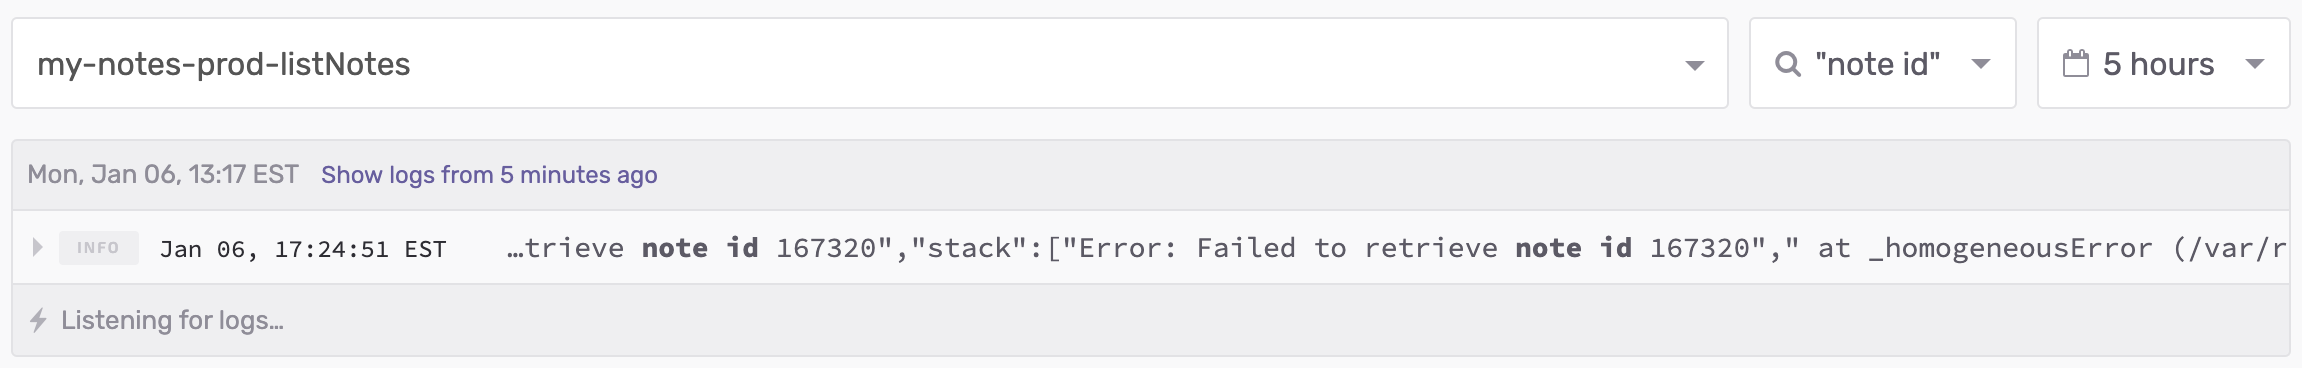
Finally, Seed will highlight the filtered logs with your search terms.
A couple of neat tricks
We also have a few really handy tricks to help with your workflow.
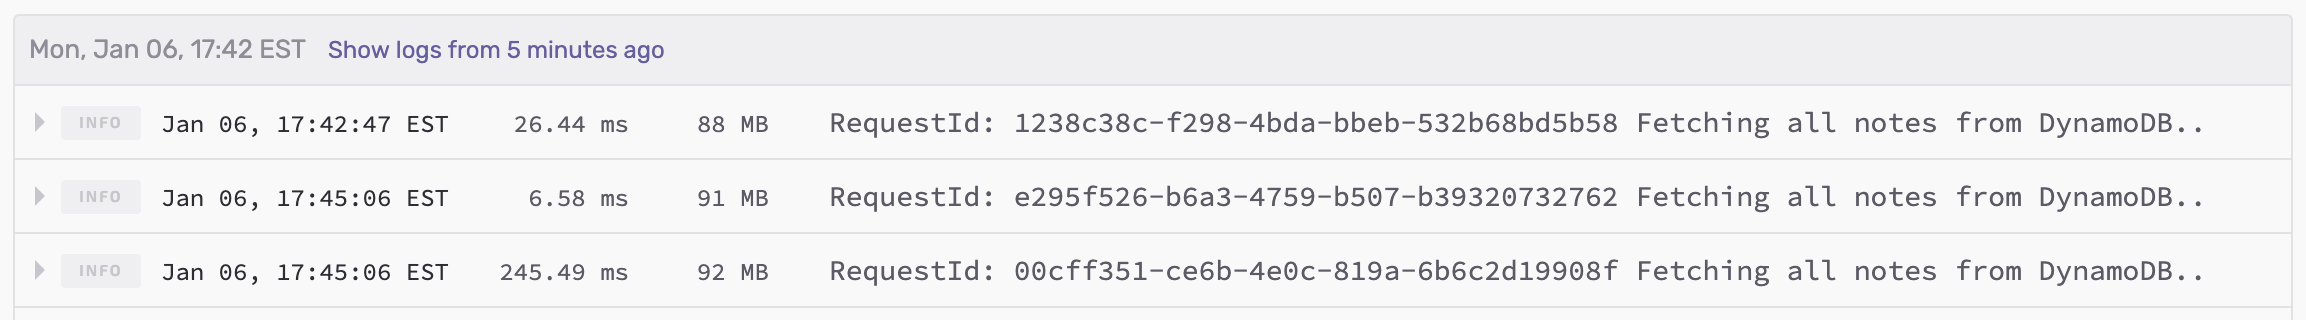
Look up logs around a given time
Often you’ll be looking for logs around a given time but you might find yourself wanting to expand the range just a little bit more. Seed allows you to easily look up logs around a given time.
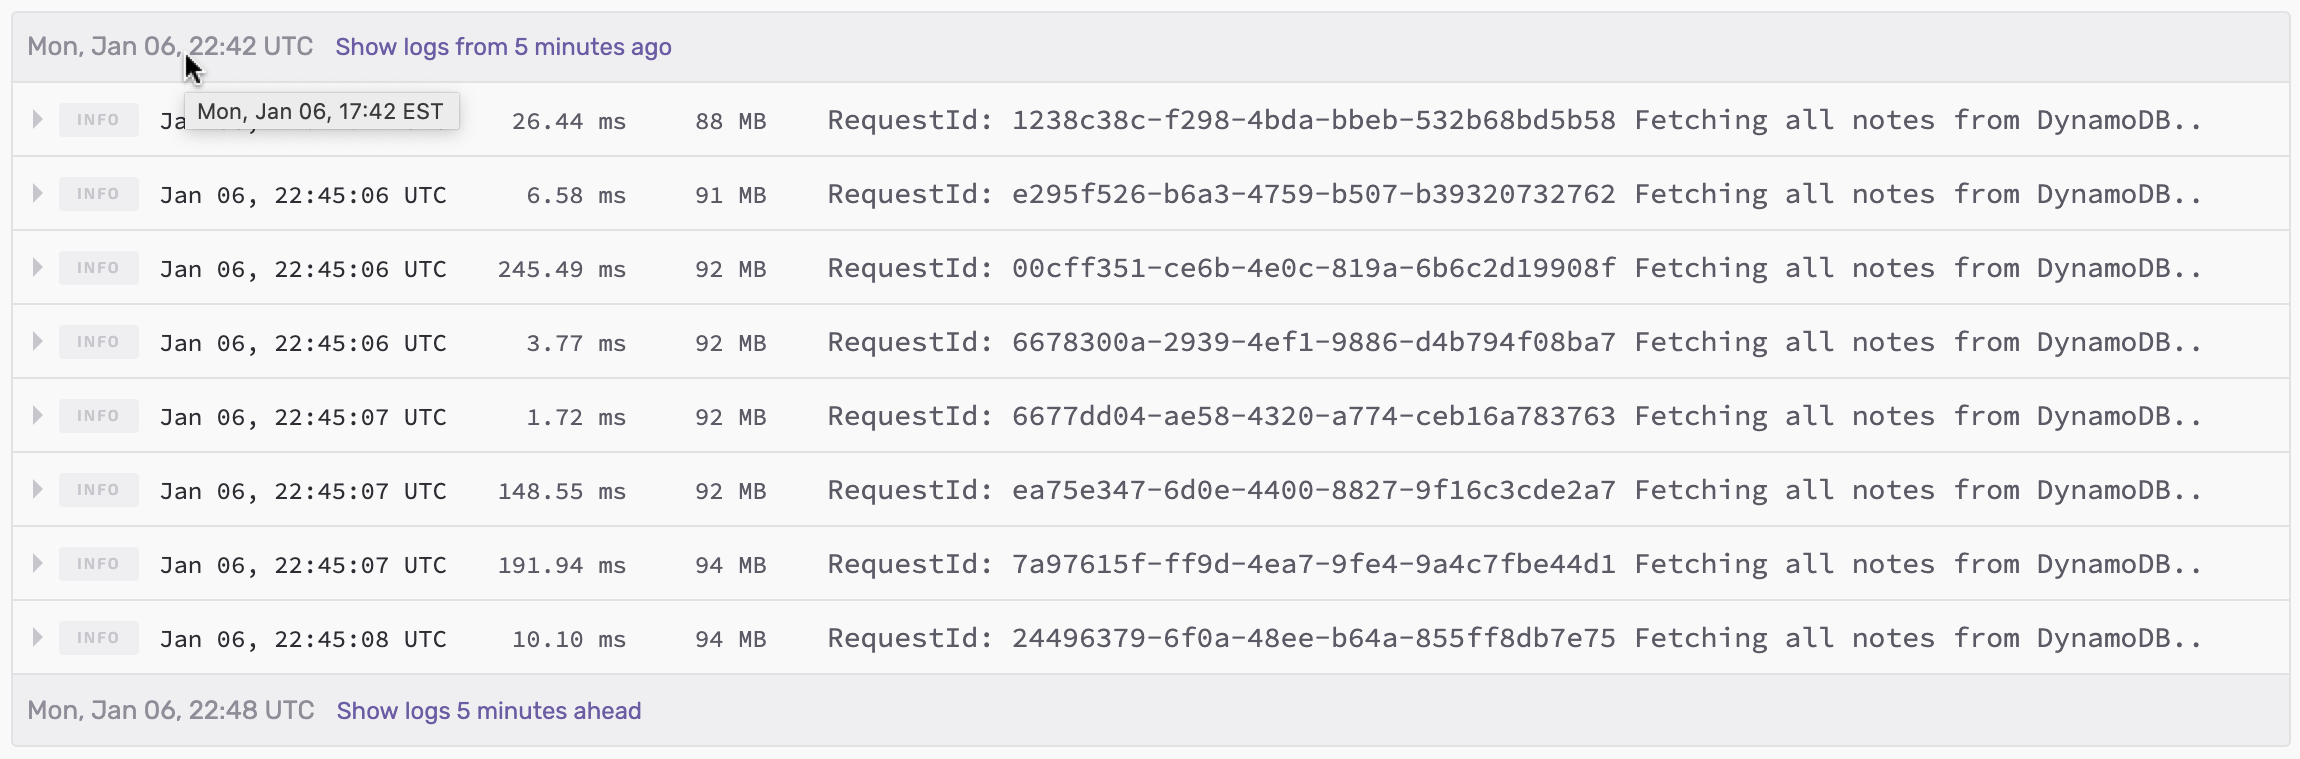
Switch timezones
You’ll also find yourself comparing your log timestamps to another service and it might use the UTC timezone. Simply click the start times to toggle between your local timezone and UTC.
Important notes
A couple of things to note with this new logs interface.
-
It is immediately available to all Seed users.
-
Seed internally uses the CloudWatch Insight APIs.
-
This means that you get unlimited log retention!
-
Viewing logs live is completely free.
-
However, AWS will charge you based on the amount of logs that are queried. When you filter your logs you are charged $0.005 per GB of log data scanned (depending on your region). So if you are querying large production apps, it’s important to be aware that there is a cost. Make sure to check for CloudWatch Analyze (Logs Insights queries) pricing for your region.
-
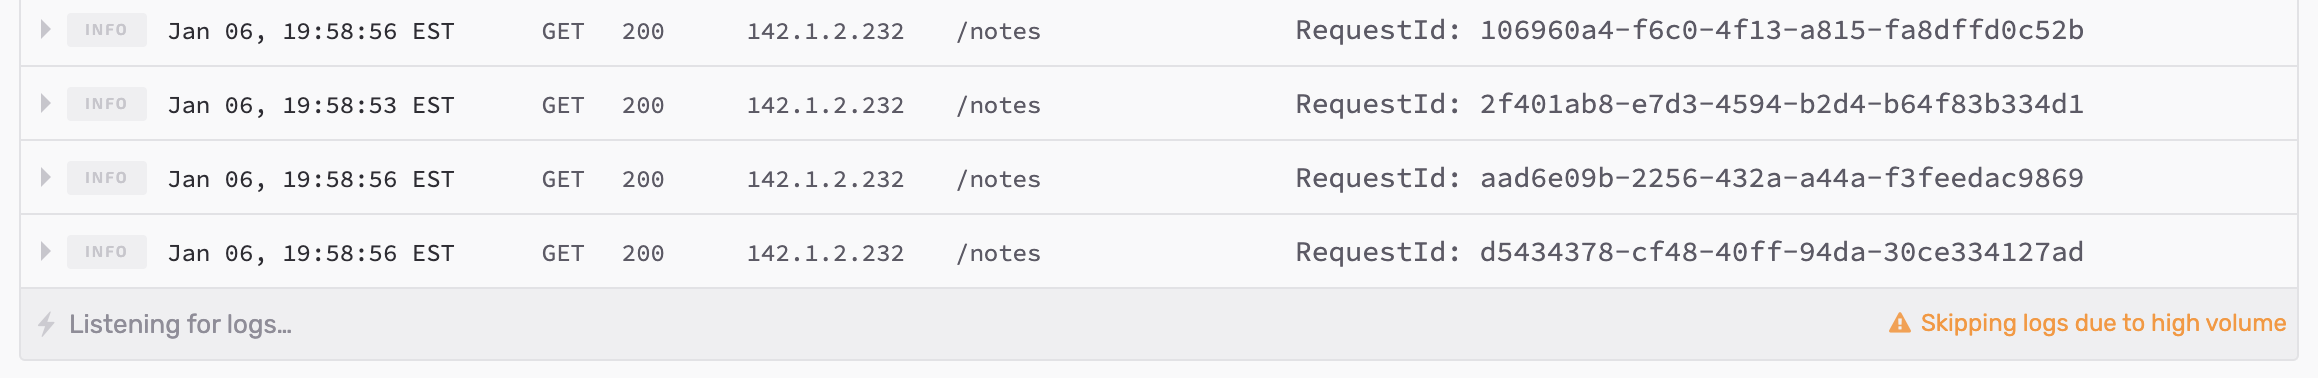
If you are viewing logs for high traffic Lambdas and API endpoints, it might skip some requests as it can be hard to keep up with the live updates.
-
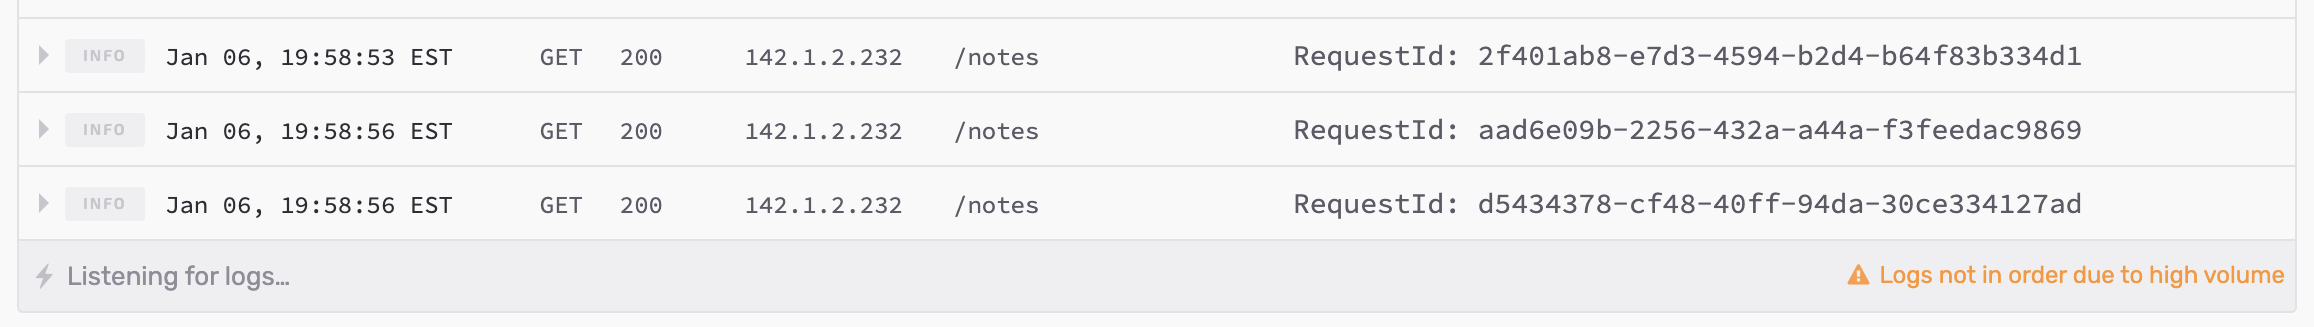
For access logs of high traffic endpoints, some of the live logs might come in slightly out of order.
Summary
We’ve been using and improving the new logs interface internally for a while now. It’s become a key part of our development workflow. It helps us quickly track down issues and debug them. We hope you can give it a try with your apps. And we’d love to hear what you think!
Do your Serverless deployments take too long? Incremental deploys in Seed can speed it up 100x!
Learn More