How to trace Serverless apps with AWS X-Ray
AWS X-Ray is a service that records and visualizes requests made by your application. It provides an end-to-end view of requests as they travel through your Serverless application, and shows a map of your application’s underlying components.
To get a better understanding of how X-Ray works and why you should consider using it, we’ve got a detailed post here.
In this post we will show you how to set up AWS X-Ray to trace API requests and Lambda invocations for your Serverless Framework applications.
Enable X-Ray tracing for API Gateway and Lambda
First let’s start by enabling X-Ray for your application.
Open your serverless.yml and add a tracing config inside the provider section:
provider:
  ...
  tracing:
    apiGateway: true
    lambda: true
Then add the IAM permissions required for Lambda to write to X-Ray under iamRoleStatements inside the provider section:
provider:
  ...
  iamRoleStatements:
    - Effect: Allow
      Action:
        ...
        - xray:PutTraceSegments
        - xray:PutTelemetryRecords
      Resource: "*"
Let’s use the following Lambda function as an example.
const AWS = require('aws-sdk');
const dynamodb = new AWS.DynamoDB.DocumentClient();
const sns = new AWS.SNS();

exports.main = async function(event) {
  await dynamodb.get({
    TableName: 'notes',
    Key: { noteId: 'note1' },
  }).promise();

  await sns.publish({
    Message           : 'test',
    TopicArn          : 'arn:aws:sns:us-east-1:113345762000:test-topic',
  }).promise();


  return { statusCode: 200, body: 'successful' };
}
Now run serverless deploy to deploy your service. Make sure to deploy your entire applicaiton (not just an individual function), since you made changes to your serverless.yml.
Note that, if you are trying to enable AWS X-Ray Tracing on existing Serverless projects, make sure your Serverless CLI version is later than 1.44.
After you deploy, invoke your API Gateway endpoint:
$ curl https://xxxxxxxxxx.execute-api.us-east-1.amazonaws.com/xxx
Head over to your AWS X-Ray console, and select Traces from the left menu.
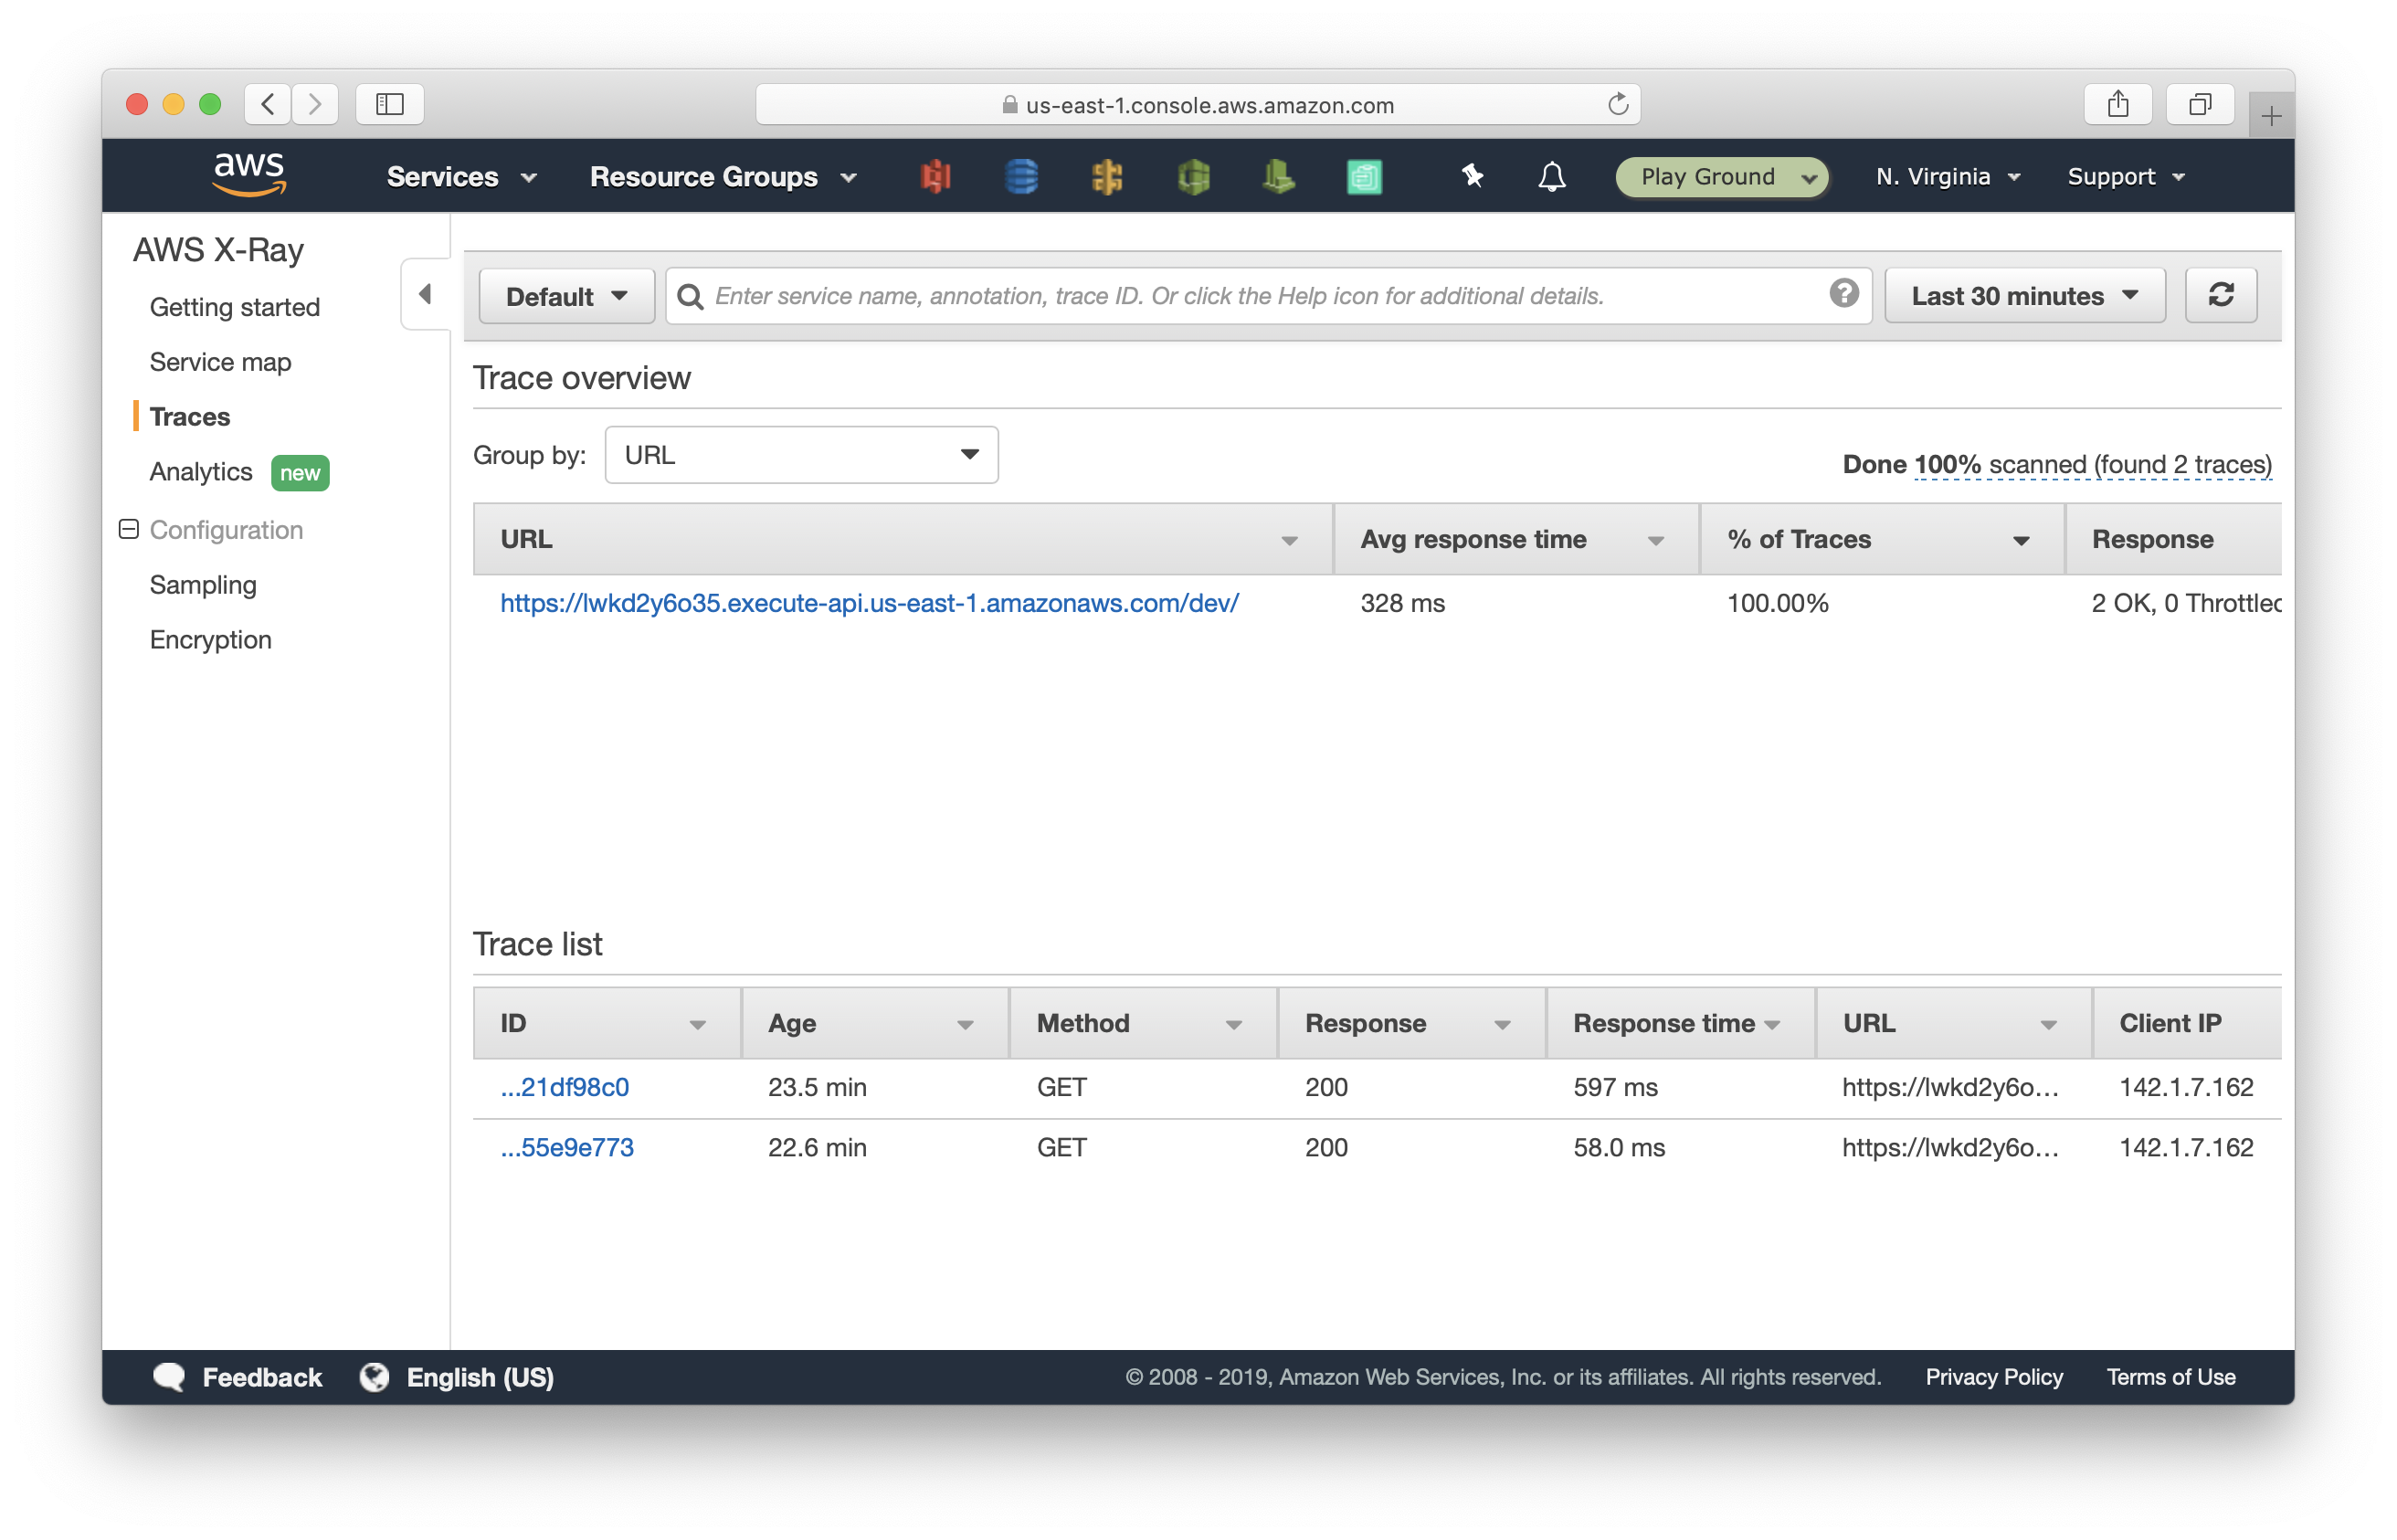
The Trace overview section at the top shows all the URLs that initiated the trace. And the Trace list section at the bottom shows each individual trace. By default, it shows all the traces within the last 5 minutes. However, you can pick a different time range.
Click on a trace in the Trace list. Note: it might take up to 30 seconds before a trace shows up after a request has been made.
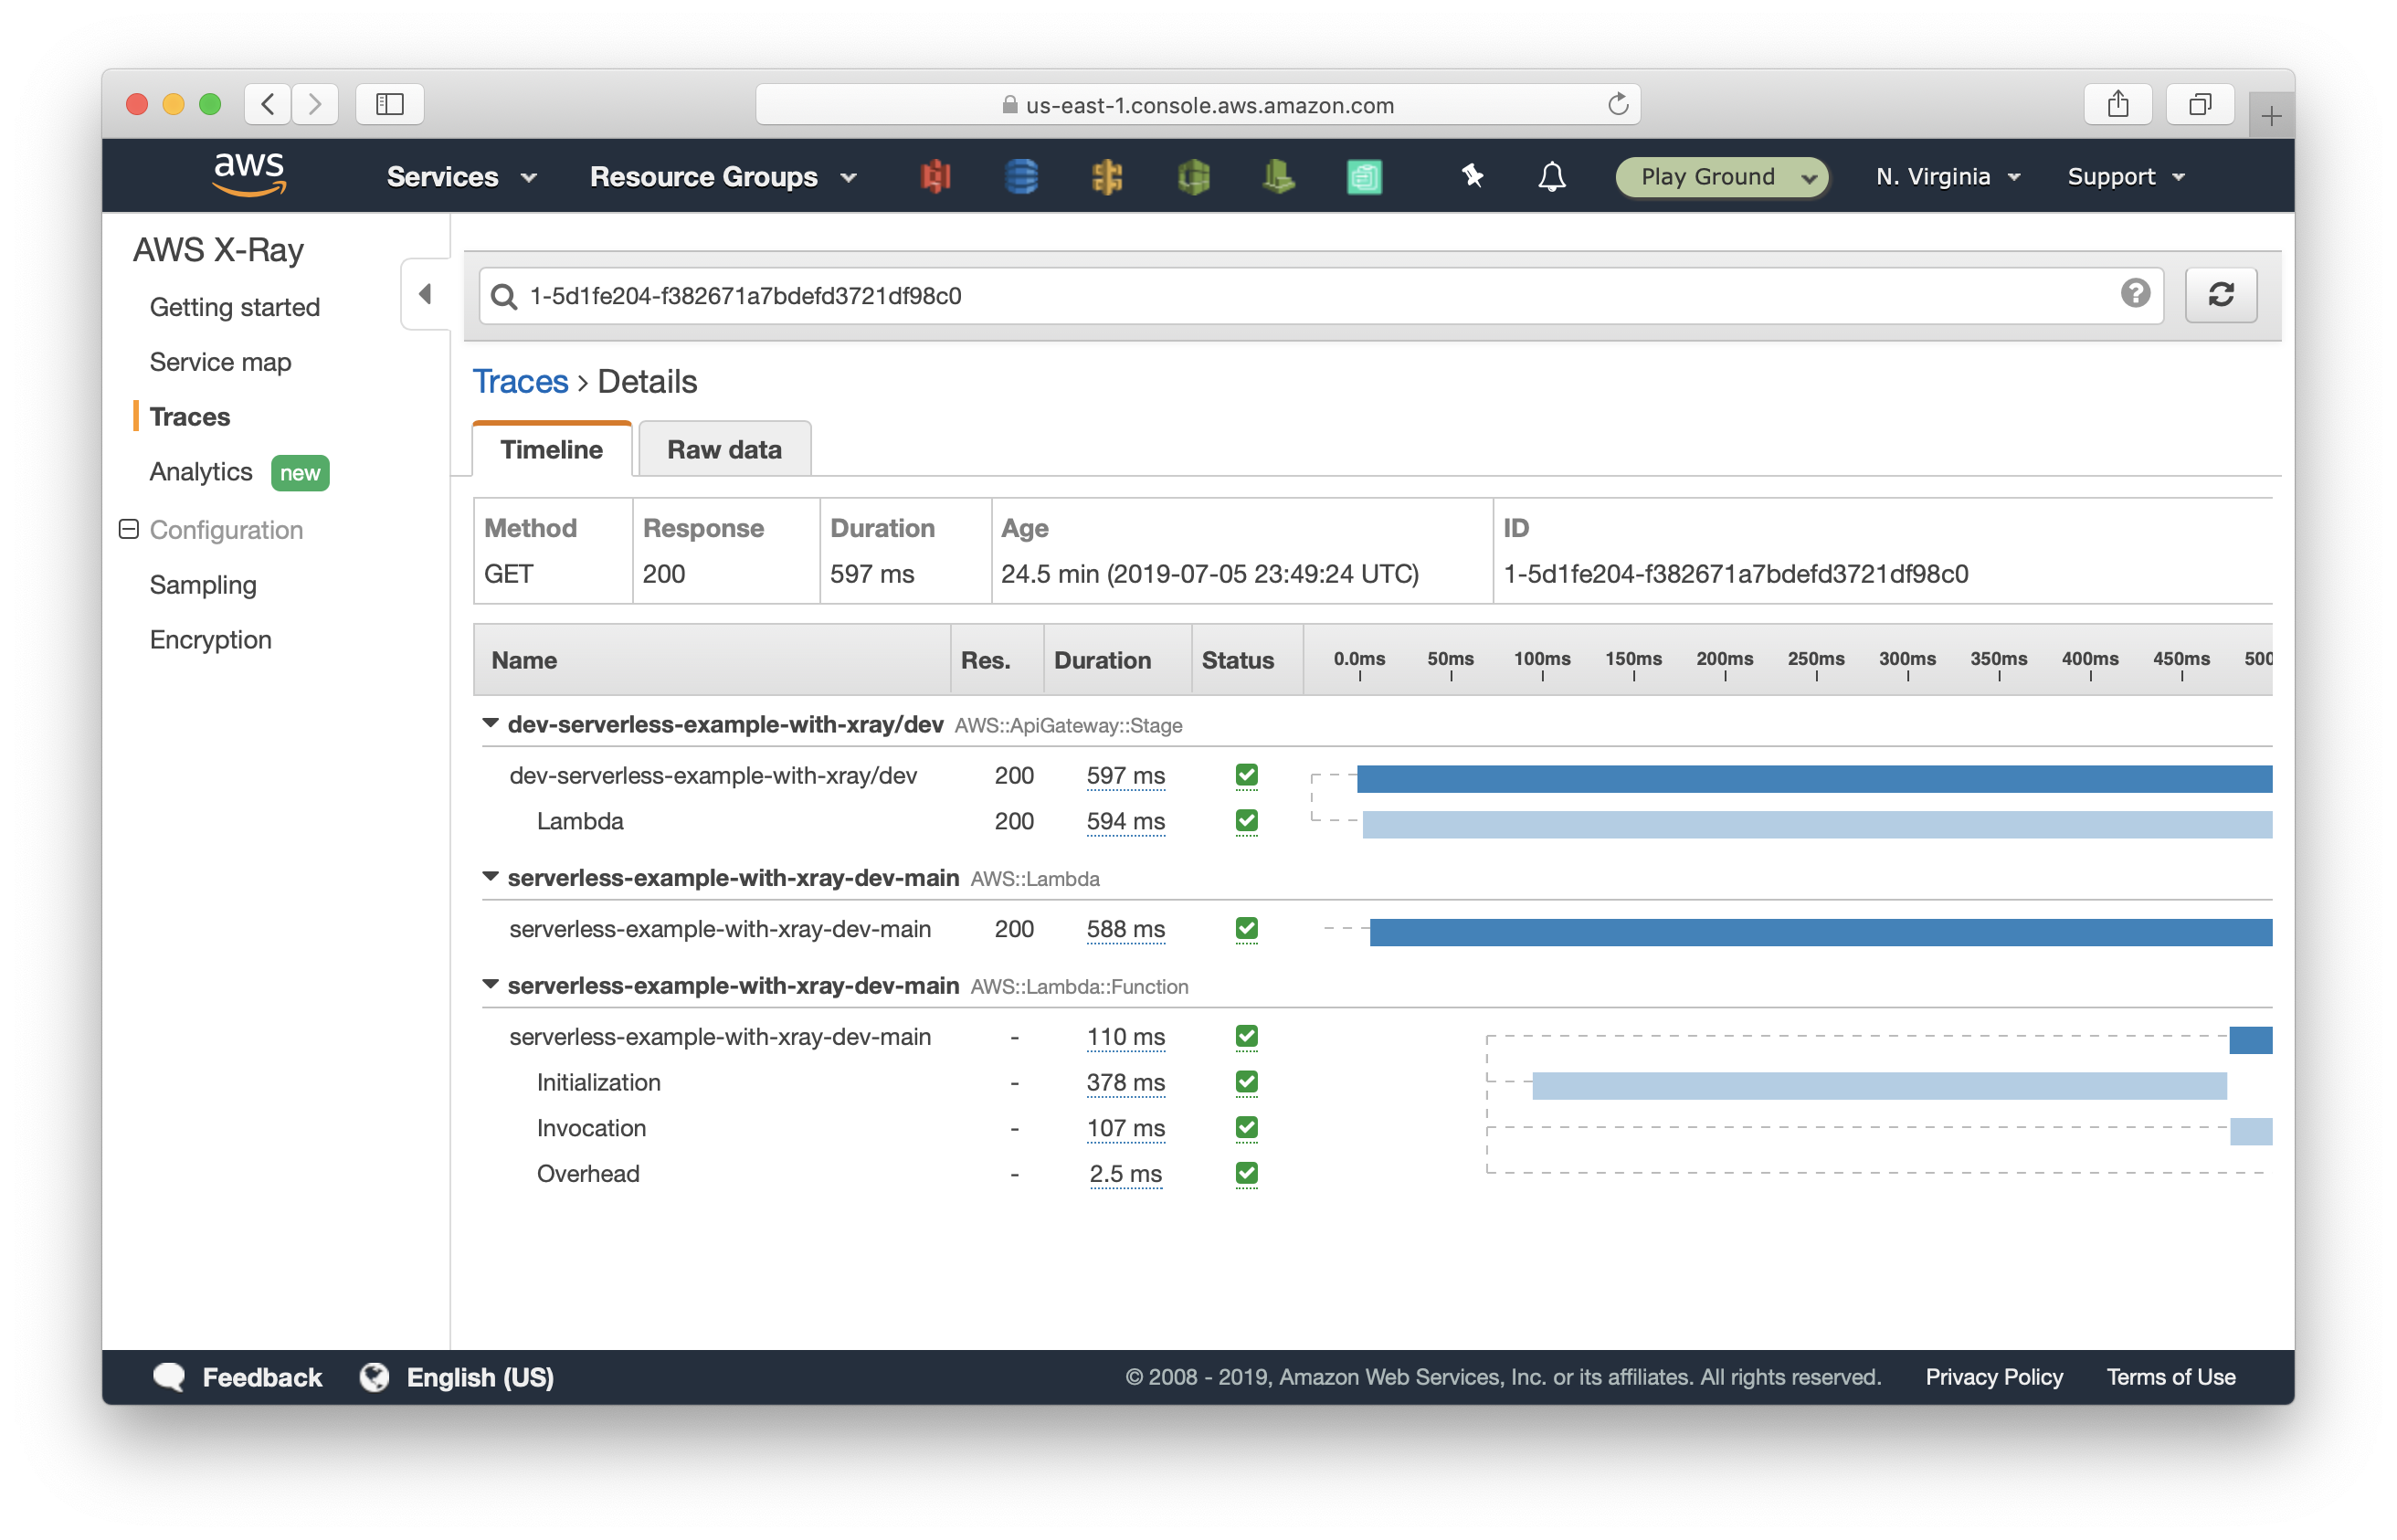
Here are a couple of things you can see:
- The API request was a GET request and succeeded with a HTTP 200 status.
- The entire request took API Gateway 597ms to process.
- Out of 597ms, 594ms was spent by Lambda function. Meaning API Gateway added an overhead of 3ms to this request.
- And out of 594ms, it took 387ms for Lambda to initialize. That’s the Cold Start time.
- The actual function took 107ms to run.
However I’m still left wondering about:
- How long did the DyanmoDB query and the SNS call each take?
- If an API request fails, how do I know if it failed at the DynamoDB step or the SNS step?
To do this we need to enable X-Ray tracing for the services that were invoked by Lambda.
Enable X-Ray tracing for other AWS services invoked by AWS Lambda
Install the AWS X-Ray SDK. In your project directory, run:
$ npm install -s aws-xray-sdk
Update your Lambda code and wrap AWS SDK with the X-Ray SDK. Change:
const AWS = require('aws-sdk');
...
To:
const AWSXRay = require('aws-xray-sdk-core');
const AWS = AWSXRay.captureAWS(require('aws-sdk'));
...
That’s it!
Now run serverless deploy again to deploy the change. This time you can deploy a single function using serverless deploy -f FUNCTION_NAME, since we only changed the function code, not our serverless.yml.
After you deploy, invoke your API Gateway endpoint again:
$ curl https://xxxxxxxxxx.execute-api.us-east-1.amazonaws.com/xxx
Go back to your AWS X-Ray console, wait for the new trace to show up. It might take up to 30 seconds to do so. You can tell if a trace is recent by looking at its Age:
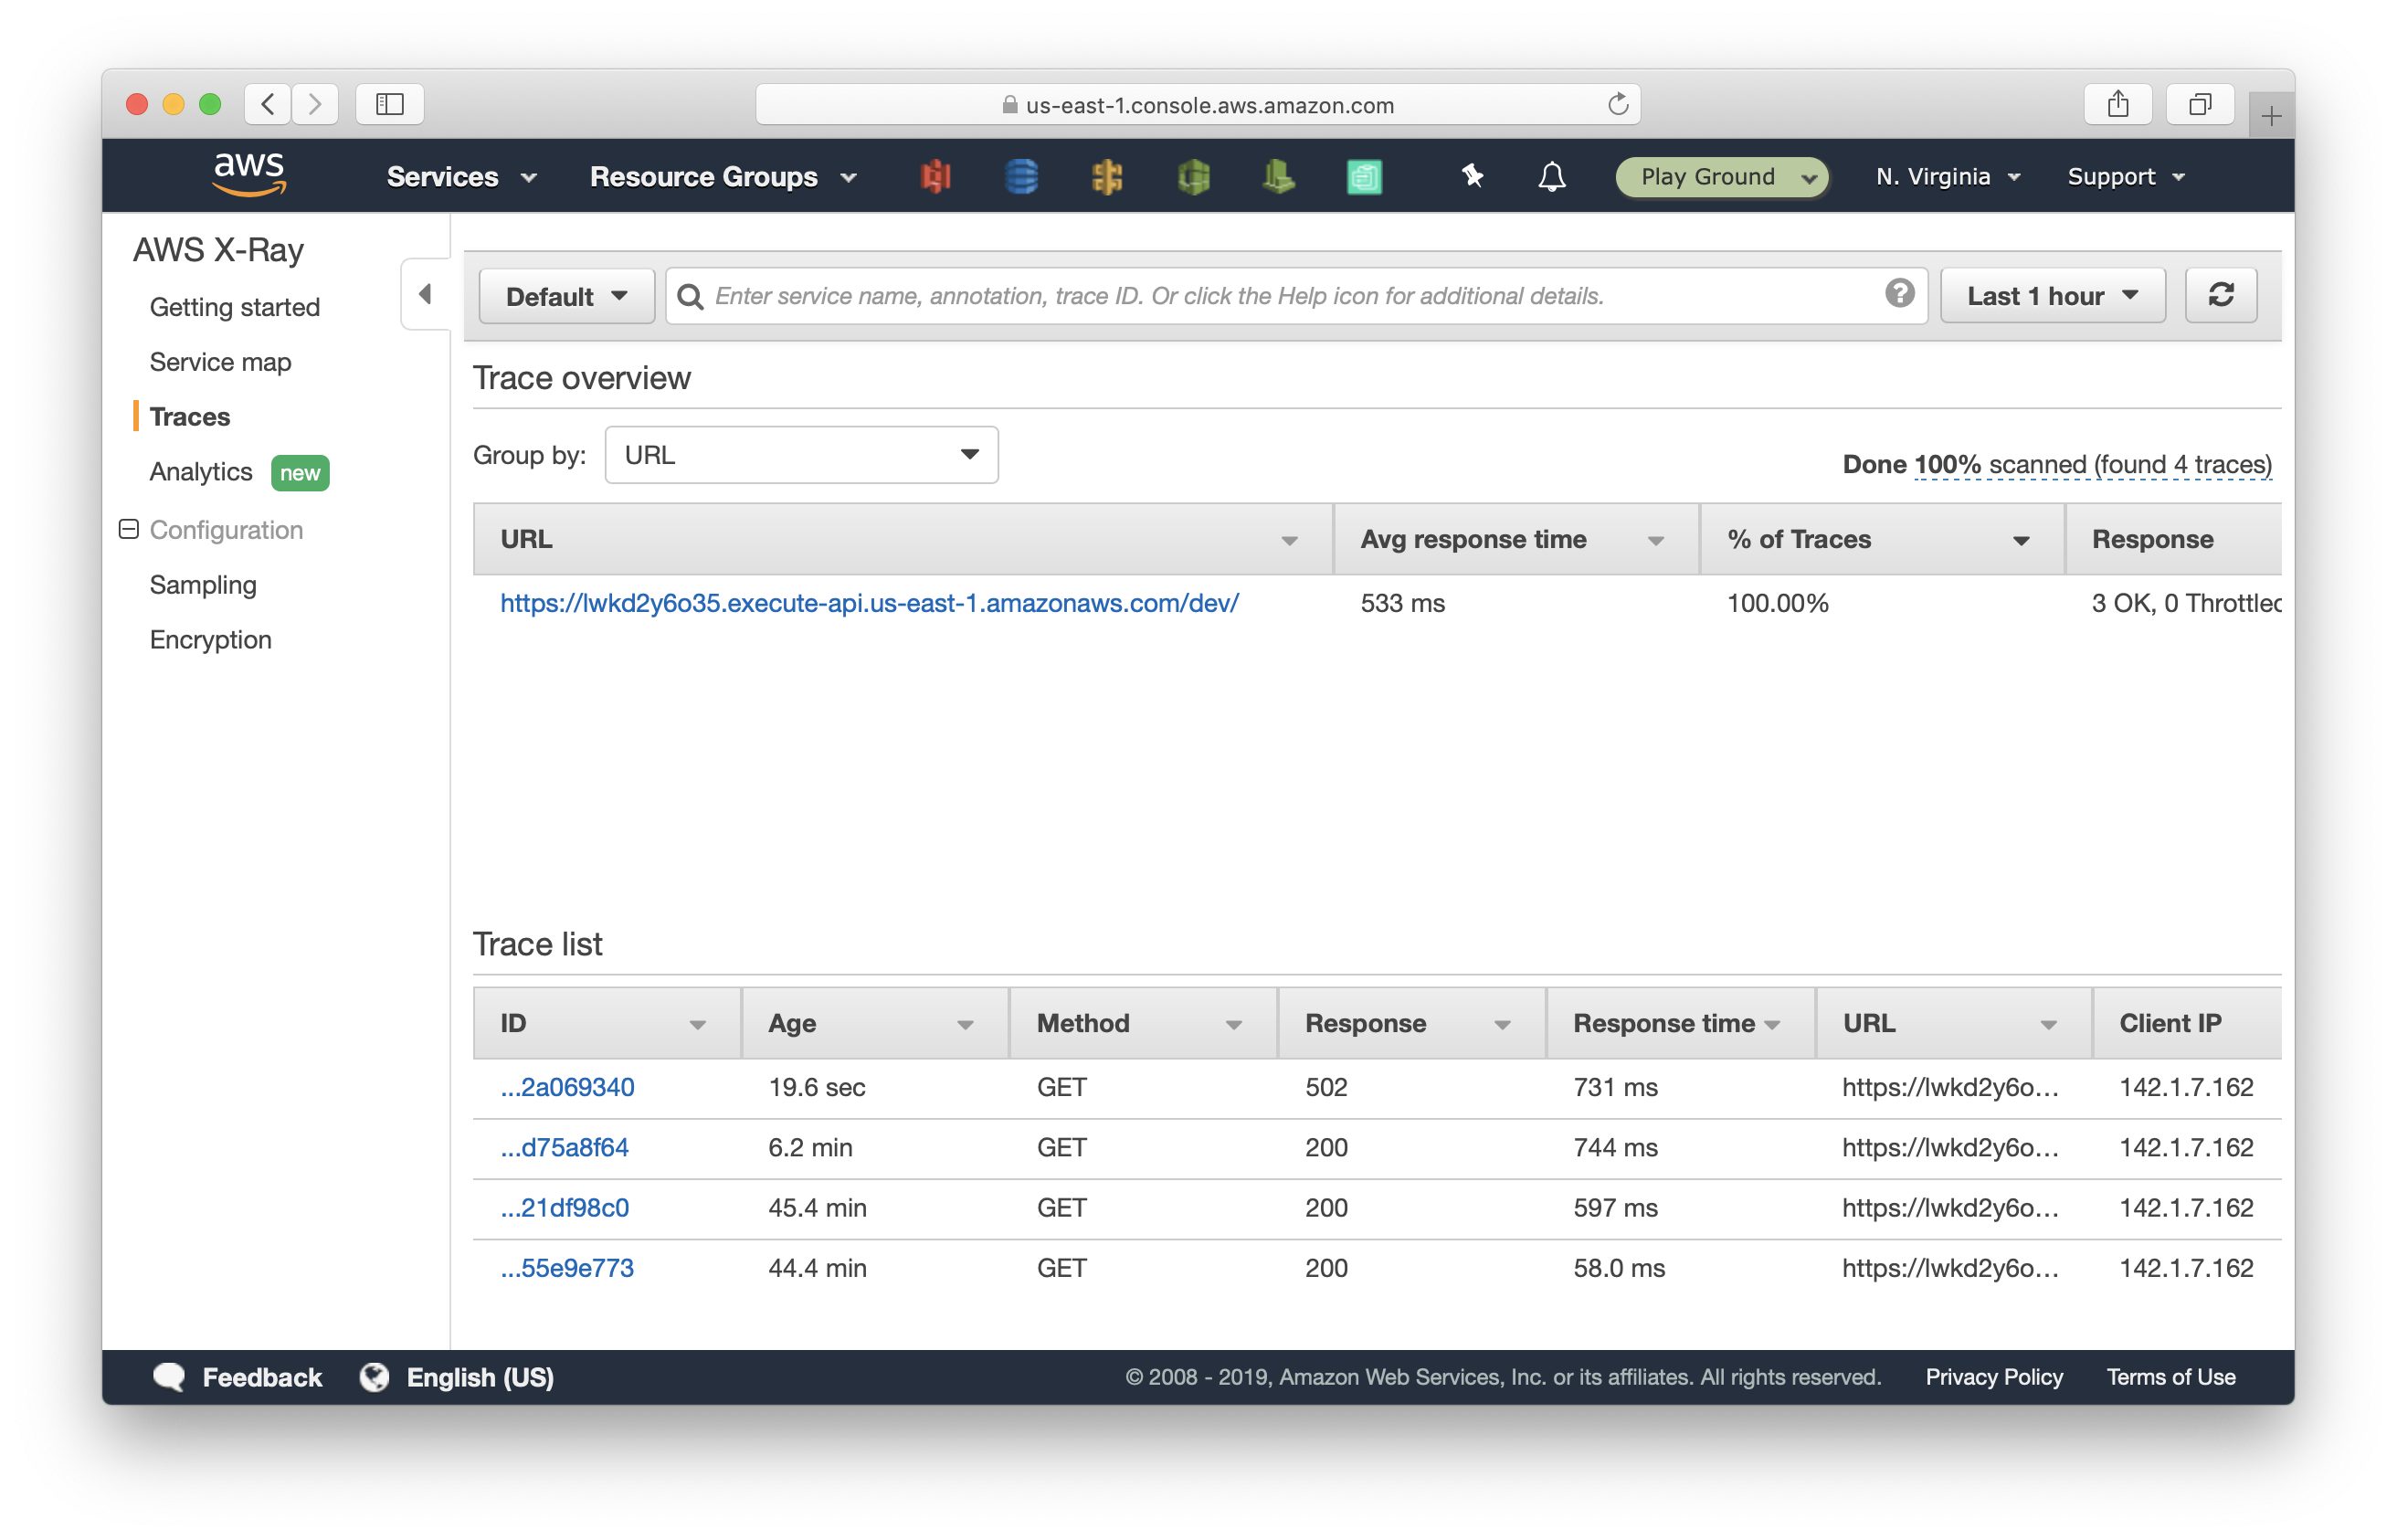
Select the new trace.
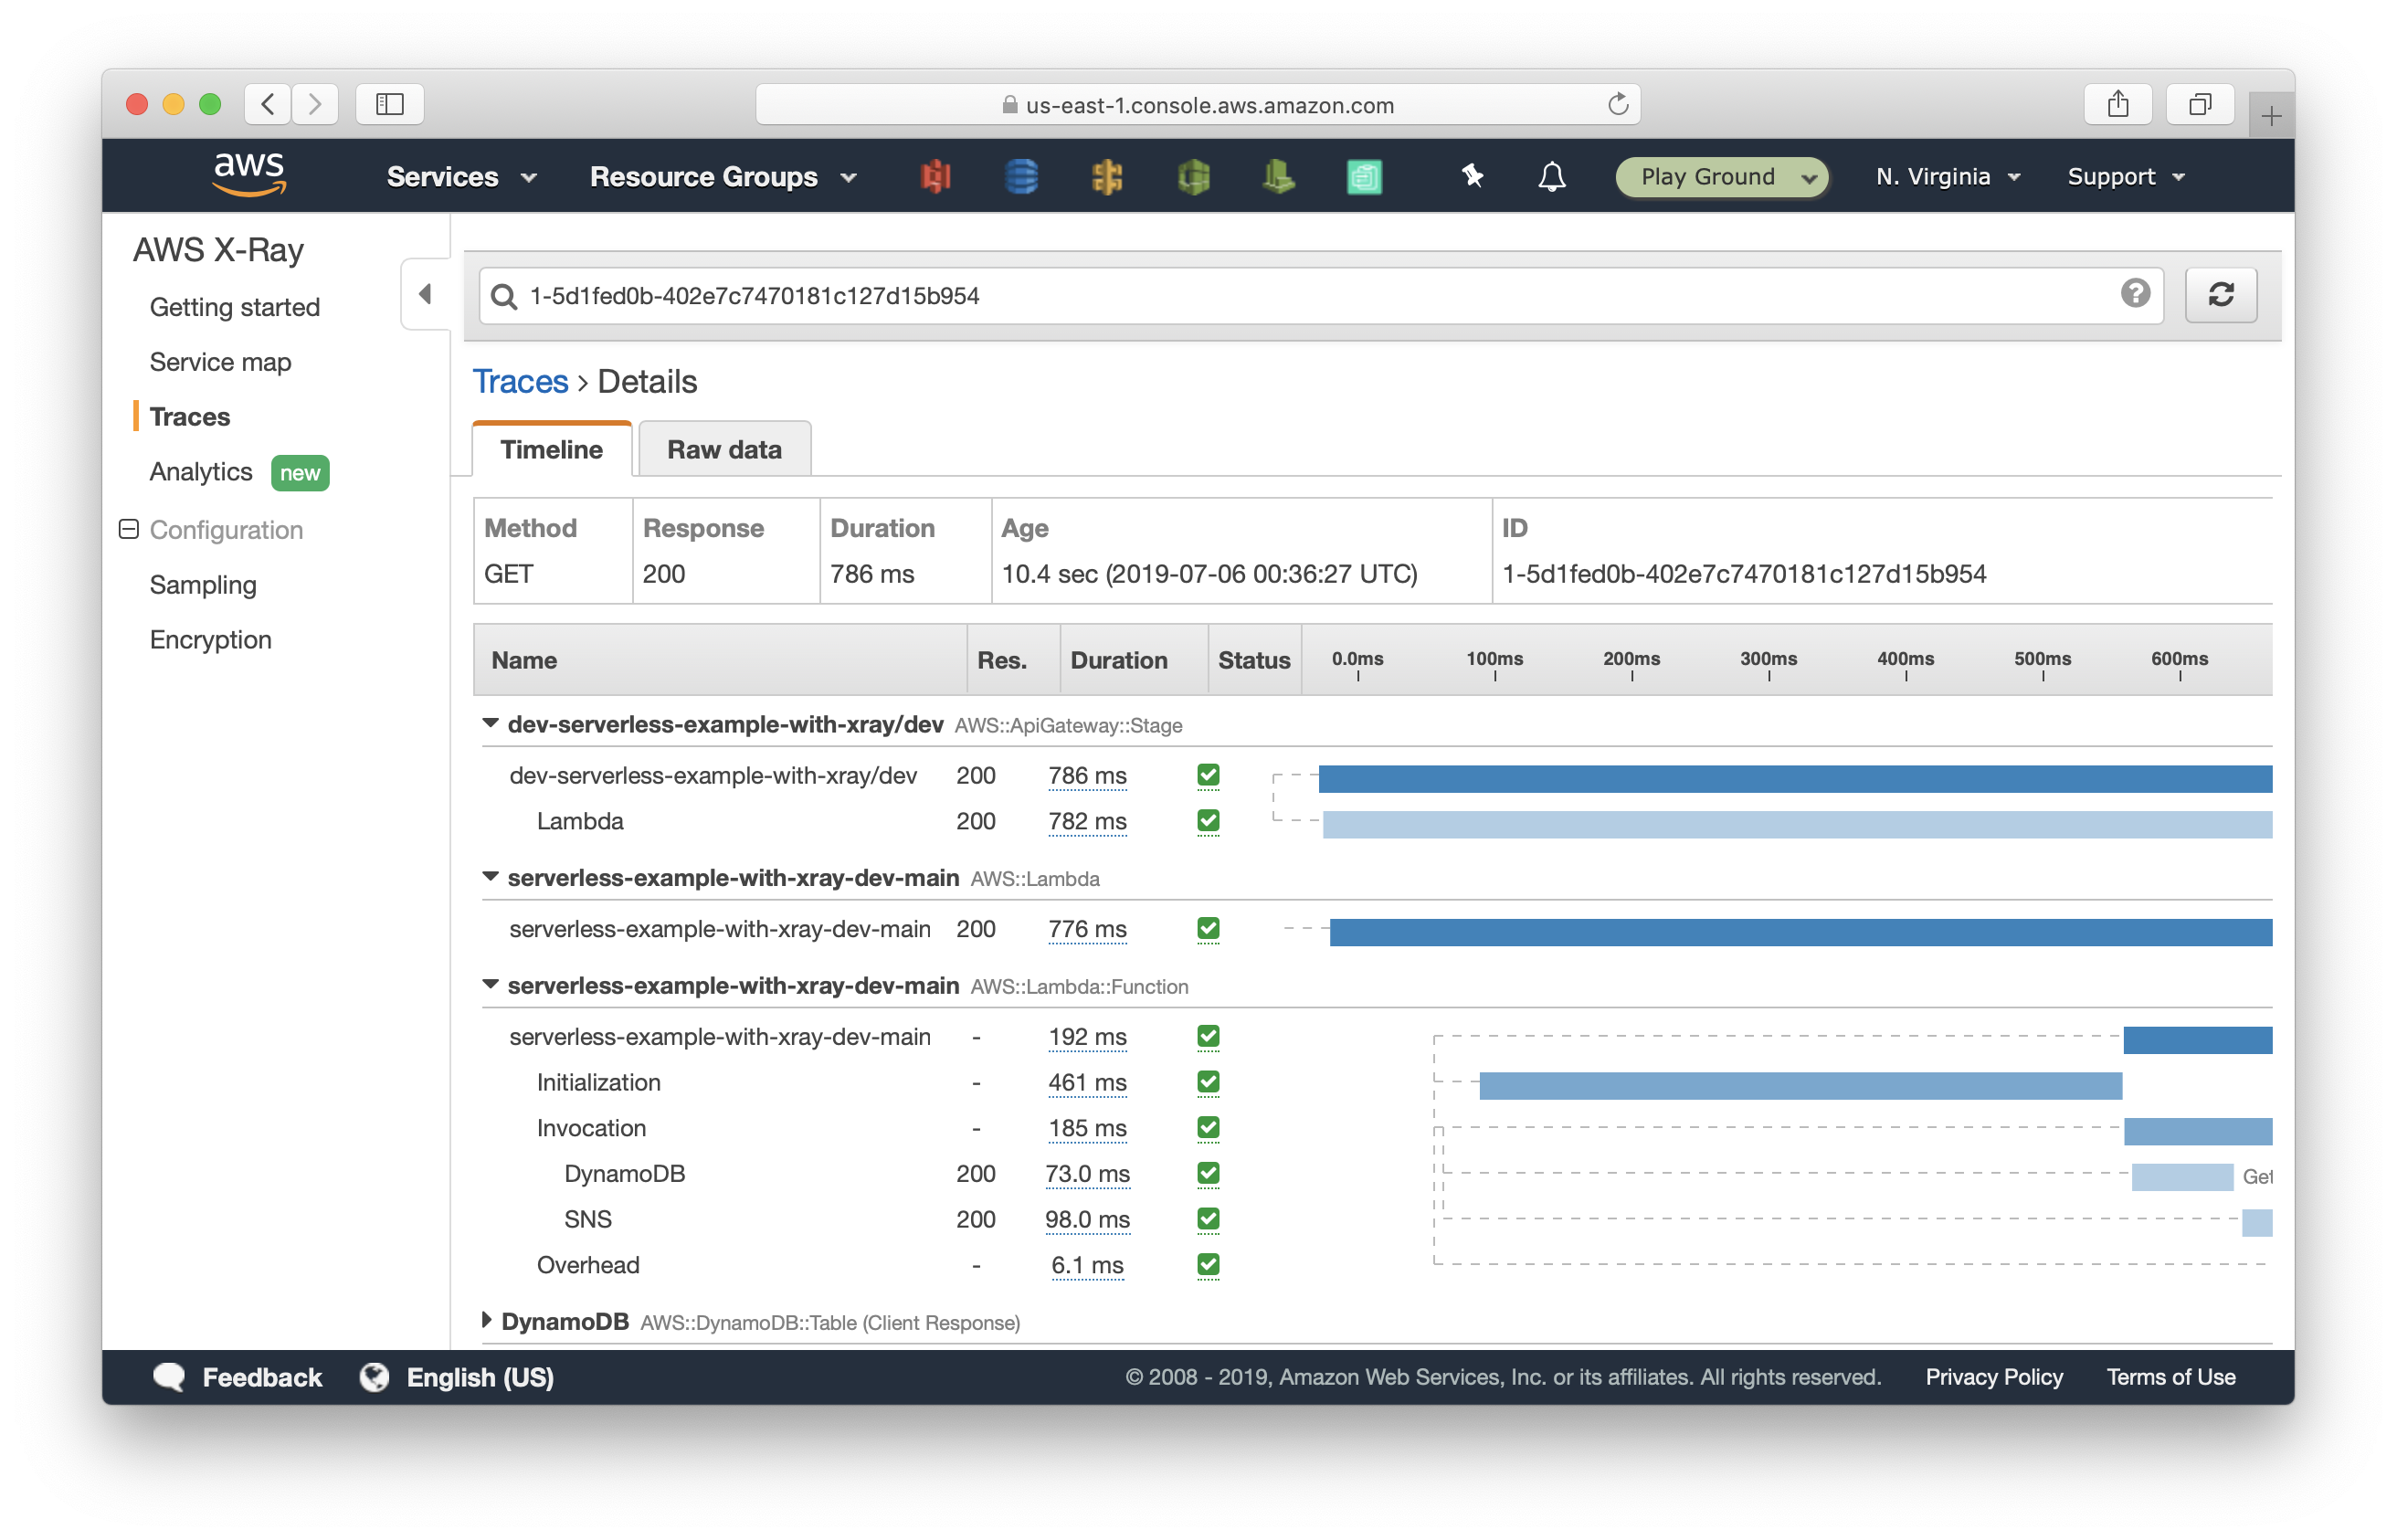
This time:
- The Lambda cold start took 461ms, and 185ms to process the request.
- Out of the 185ms, the DynamoDB query took 73ms and the SNS publish call took 98ms.
We can also see clearly the various steps that took place as a part of our Lambda function invocation.
The full version of the sample code used in this post can be found here - serverless-example-with-xray.
Do your Serverless deployments take too long? Incremental deploys in Seed can speed it up 100x!
Learn More