What is AWS X-Ray?
In this post we’ll look at what AWS X-Ray is and why we think you should really consider using it if you are building a Serverless application. We’ll also look at how it works and how much it costs.
AWS X-Ray is a service that records and visualizes requests made by your application. It provides an end-to-end view of requests as they travel through your Serverless application, and shows a map of your application’s underlying components.
Why should I use X-Ray for my Serverless app?
Let’s start with a sample Lambda function. Imagine it’s invoked by an API Gateway endpoint, it publishes a SNS message, and makes 2 queries to DynamoDB. A fairly simple and common use case.
const aws = require('aws-sdk');
const dynamodb = new AWS.DynamoDB.DocumentClient();
const sns = new AWS.SNS();

export async function main(event, context) {
  await dynamodb.put({ ... }).promise();
  await sns.publish({ ... }).promise();
}
Now let’s suppose, a user makes an API call and gets a 500 error HTTP response. There are multiple points of failure here and there are a few possible causes for the error:
- Was the API request itself poorly formatted?
- Did API Gateway invoke the Lambda function successfully?
- Did the Lambda function experience a cold start that caused the request to timeout?
- Did SNS fail to publish the message?
- Did DynamoDB query fail?
Normally, you’d have to rely on a per-service or per-resource process to track the request down as it travels across various services. This makes it difficult to correlate the various pieces of data and create an end-to-end picture of a request from the time it originated at the end-user or service to when a response is returned by your application.
What can X-Ray do?
This is where AWS X-Ray can be really helpful. It can record a thorough chronological trace for your API request, starting from API Gateway receiving the request, all the way to sending a response back to the user. A trace would look something like this:
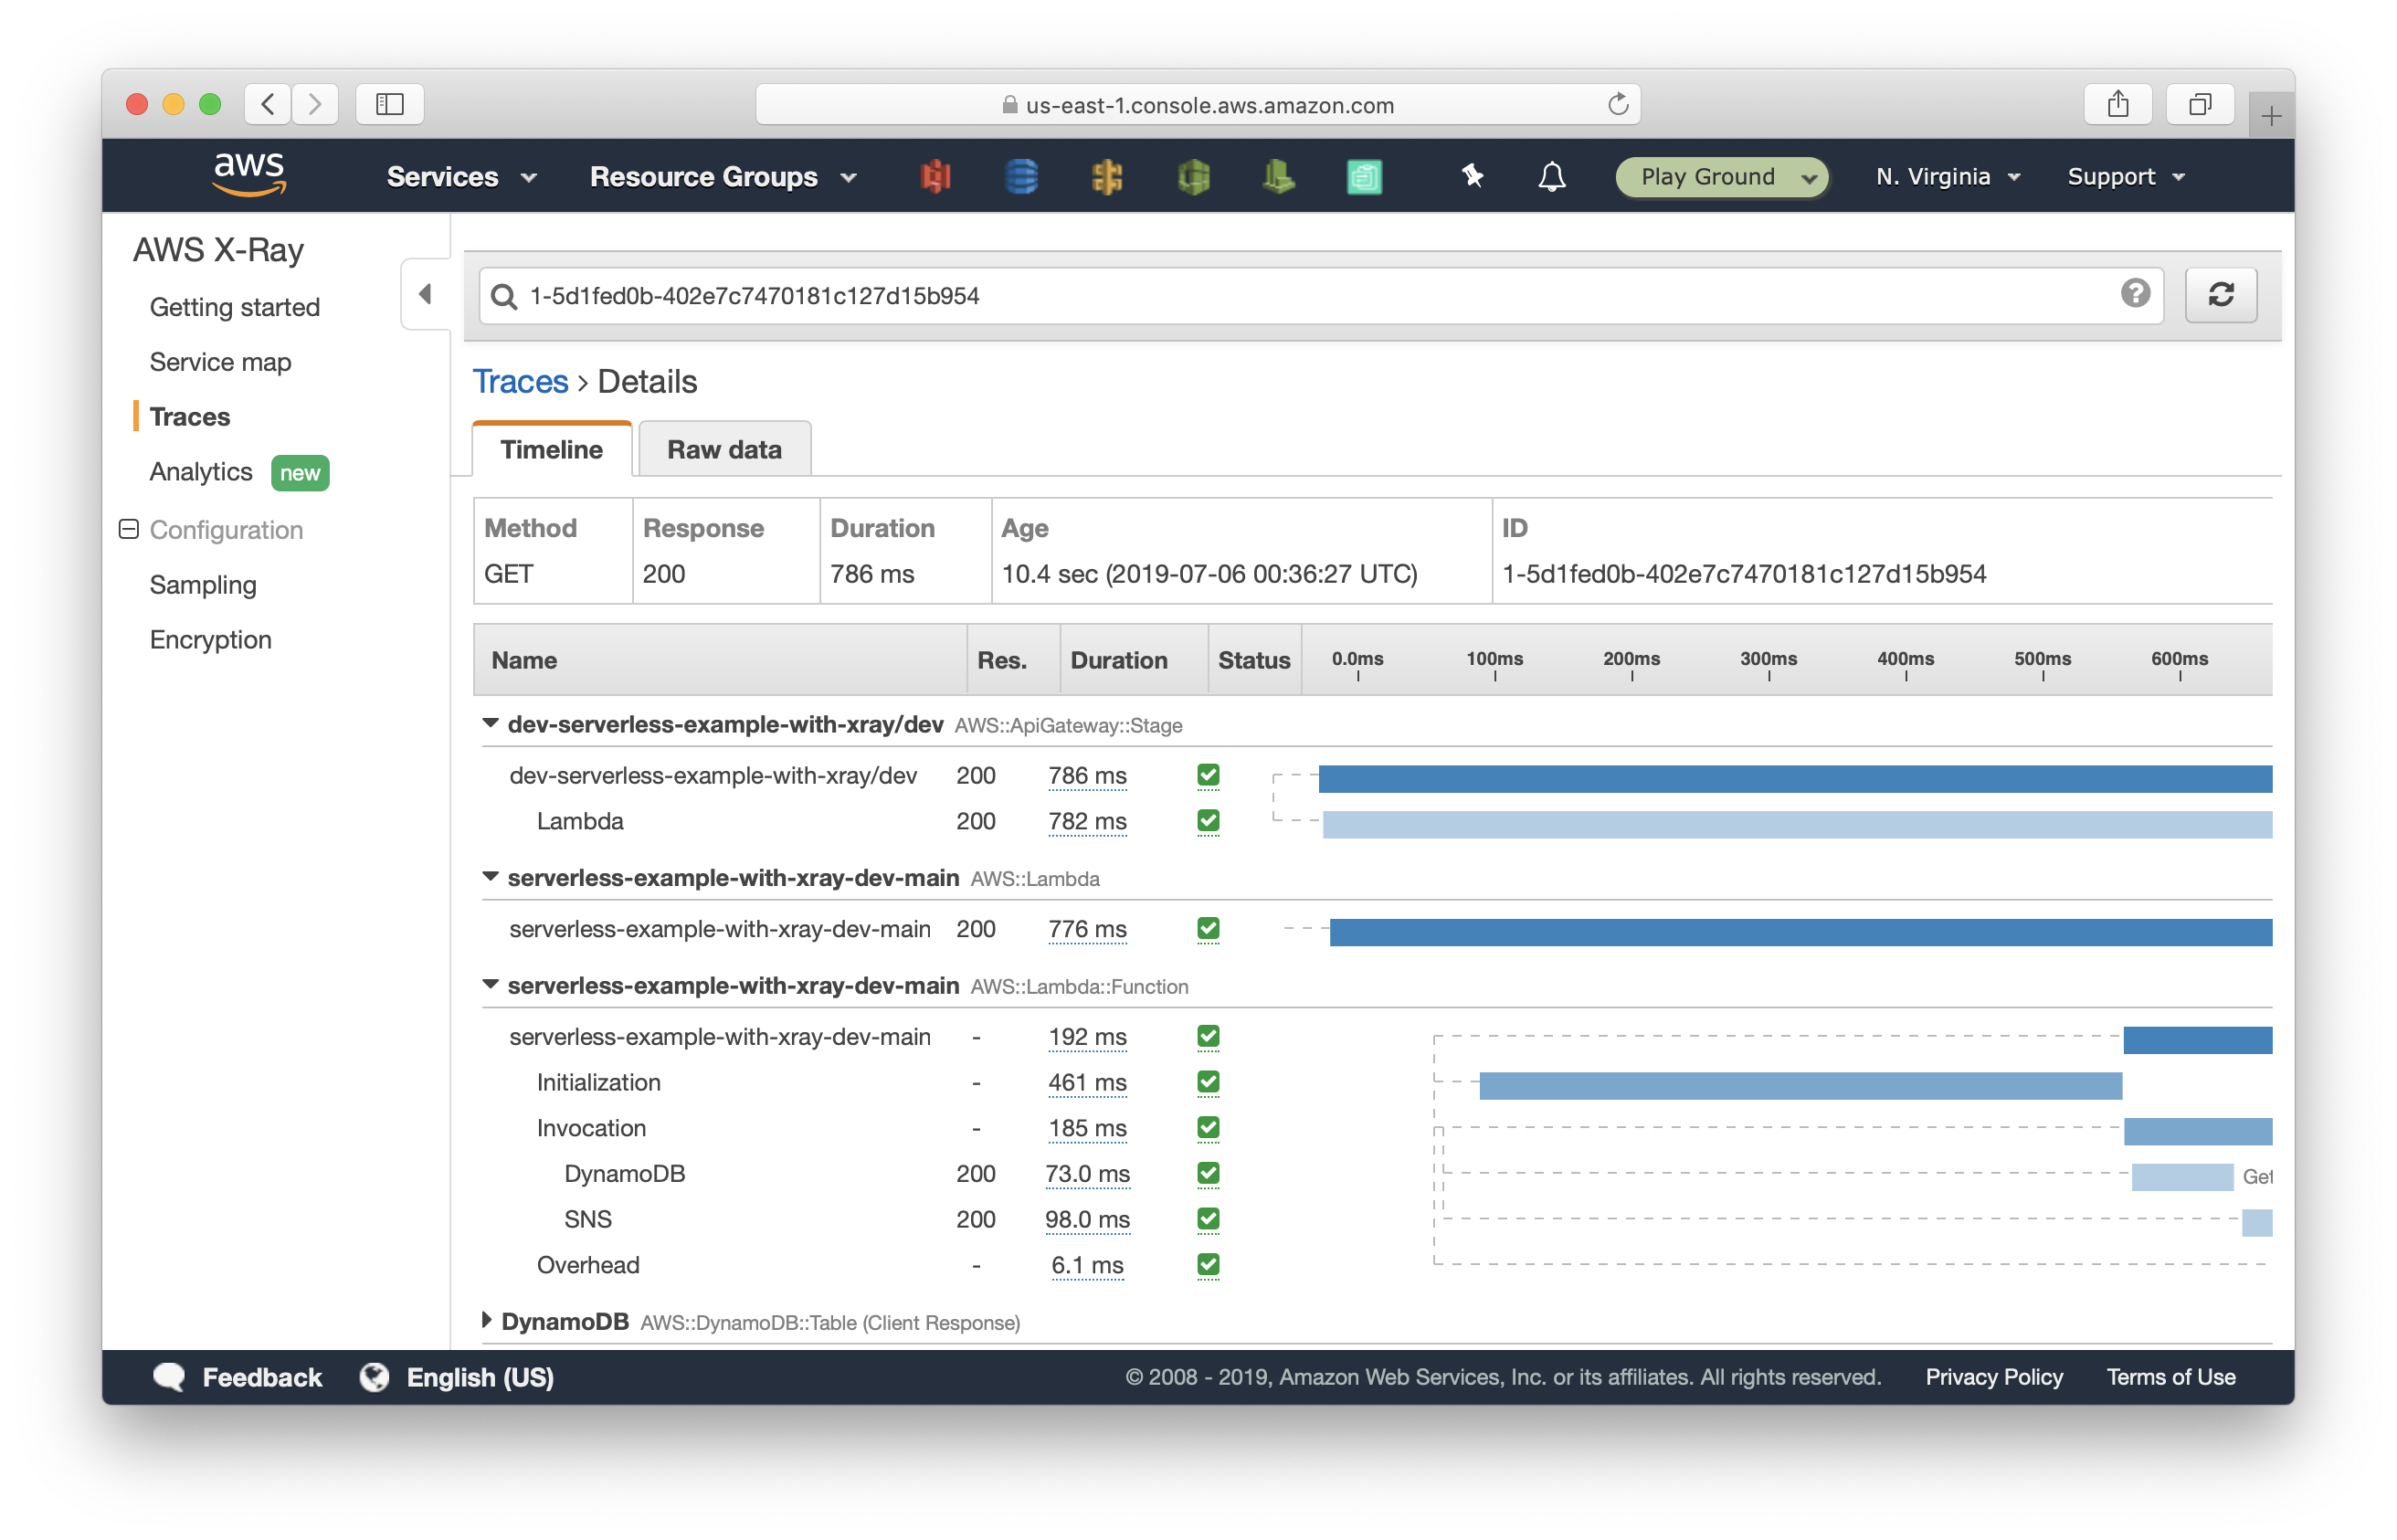
This shows:
- When the request was received by API Gateway, and how long it took.
- When the request was received by Lambda.
- How long it took for SNS to publish the request.
- How long a DynamoDB query took and the type of the query.
How does X-Ray work?
When your app receives an HTTP request, the first supported service that handles the request adds a trace ID to the header. In our example, it’s API Gateway. It then propagates the trace ID downstream to Lambda, and in turn to SNS and DynamoDB. As the ID travels the entire path of a request, it tracks the latency, disposition, and other request data. At the end of the request, all the information with the same trace ID is formatted and presented in a chronological order by AWS X-Ray.
How much does X-Ray cost?
AWS X-Ray comes with a free tier. Beyond that you are charged by the amount of requests that were traced.
This might seem expensive but you can control how much you want to trace via a sampling rate. By default, the X-Ray SDK records the first request each second, and five percent of any additional requests. You can configure X-Ray to modify the default sampling rule and configure additional rules that apply sampling based on properties of the service or request.
For example, you might want to disable sampling and trace for all requests or calls that modify state or handle user accounts or transactions. For high-volume read-only calls, like background polling, health checks, or connection maintenance, you can sample at a low rate and still get enough data to see any issues that might arise.
We cover how to enable AWS X-Ray and how to read a trace in this post here.
Do your Serverless deployments take too long? Incremental deploys in Seed can speed it up 100x!
Learn More