What's the difference between access logs and execution logs in API Gateway?
In this post we are going to be looking at two types of logs that API Gateway has, and the differences between them.
If you are just getting into Serverless and you have run into some problems with API Gateway, it can be useful to learn about the two logging options that API Gateway has. There are two API Gateway logging options in CloudWatch; execution logging and access logging.
Let’s start by looking at execution logs.
Execution logs
- This logs all the API Gateway internal information as the request is processed.
- It’s fully managed by API Gateway.
- API Gateway automatically creates a CloudWatch log group with the name
API-Gateway-Execution-Logs_{rest-api-id}/{stage_name}. - The log format is pre-defined.
- You can only choose the log level (INFO or ERROR) and whether or not to log the full API request/response data.
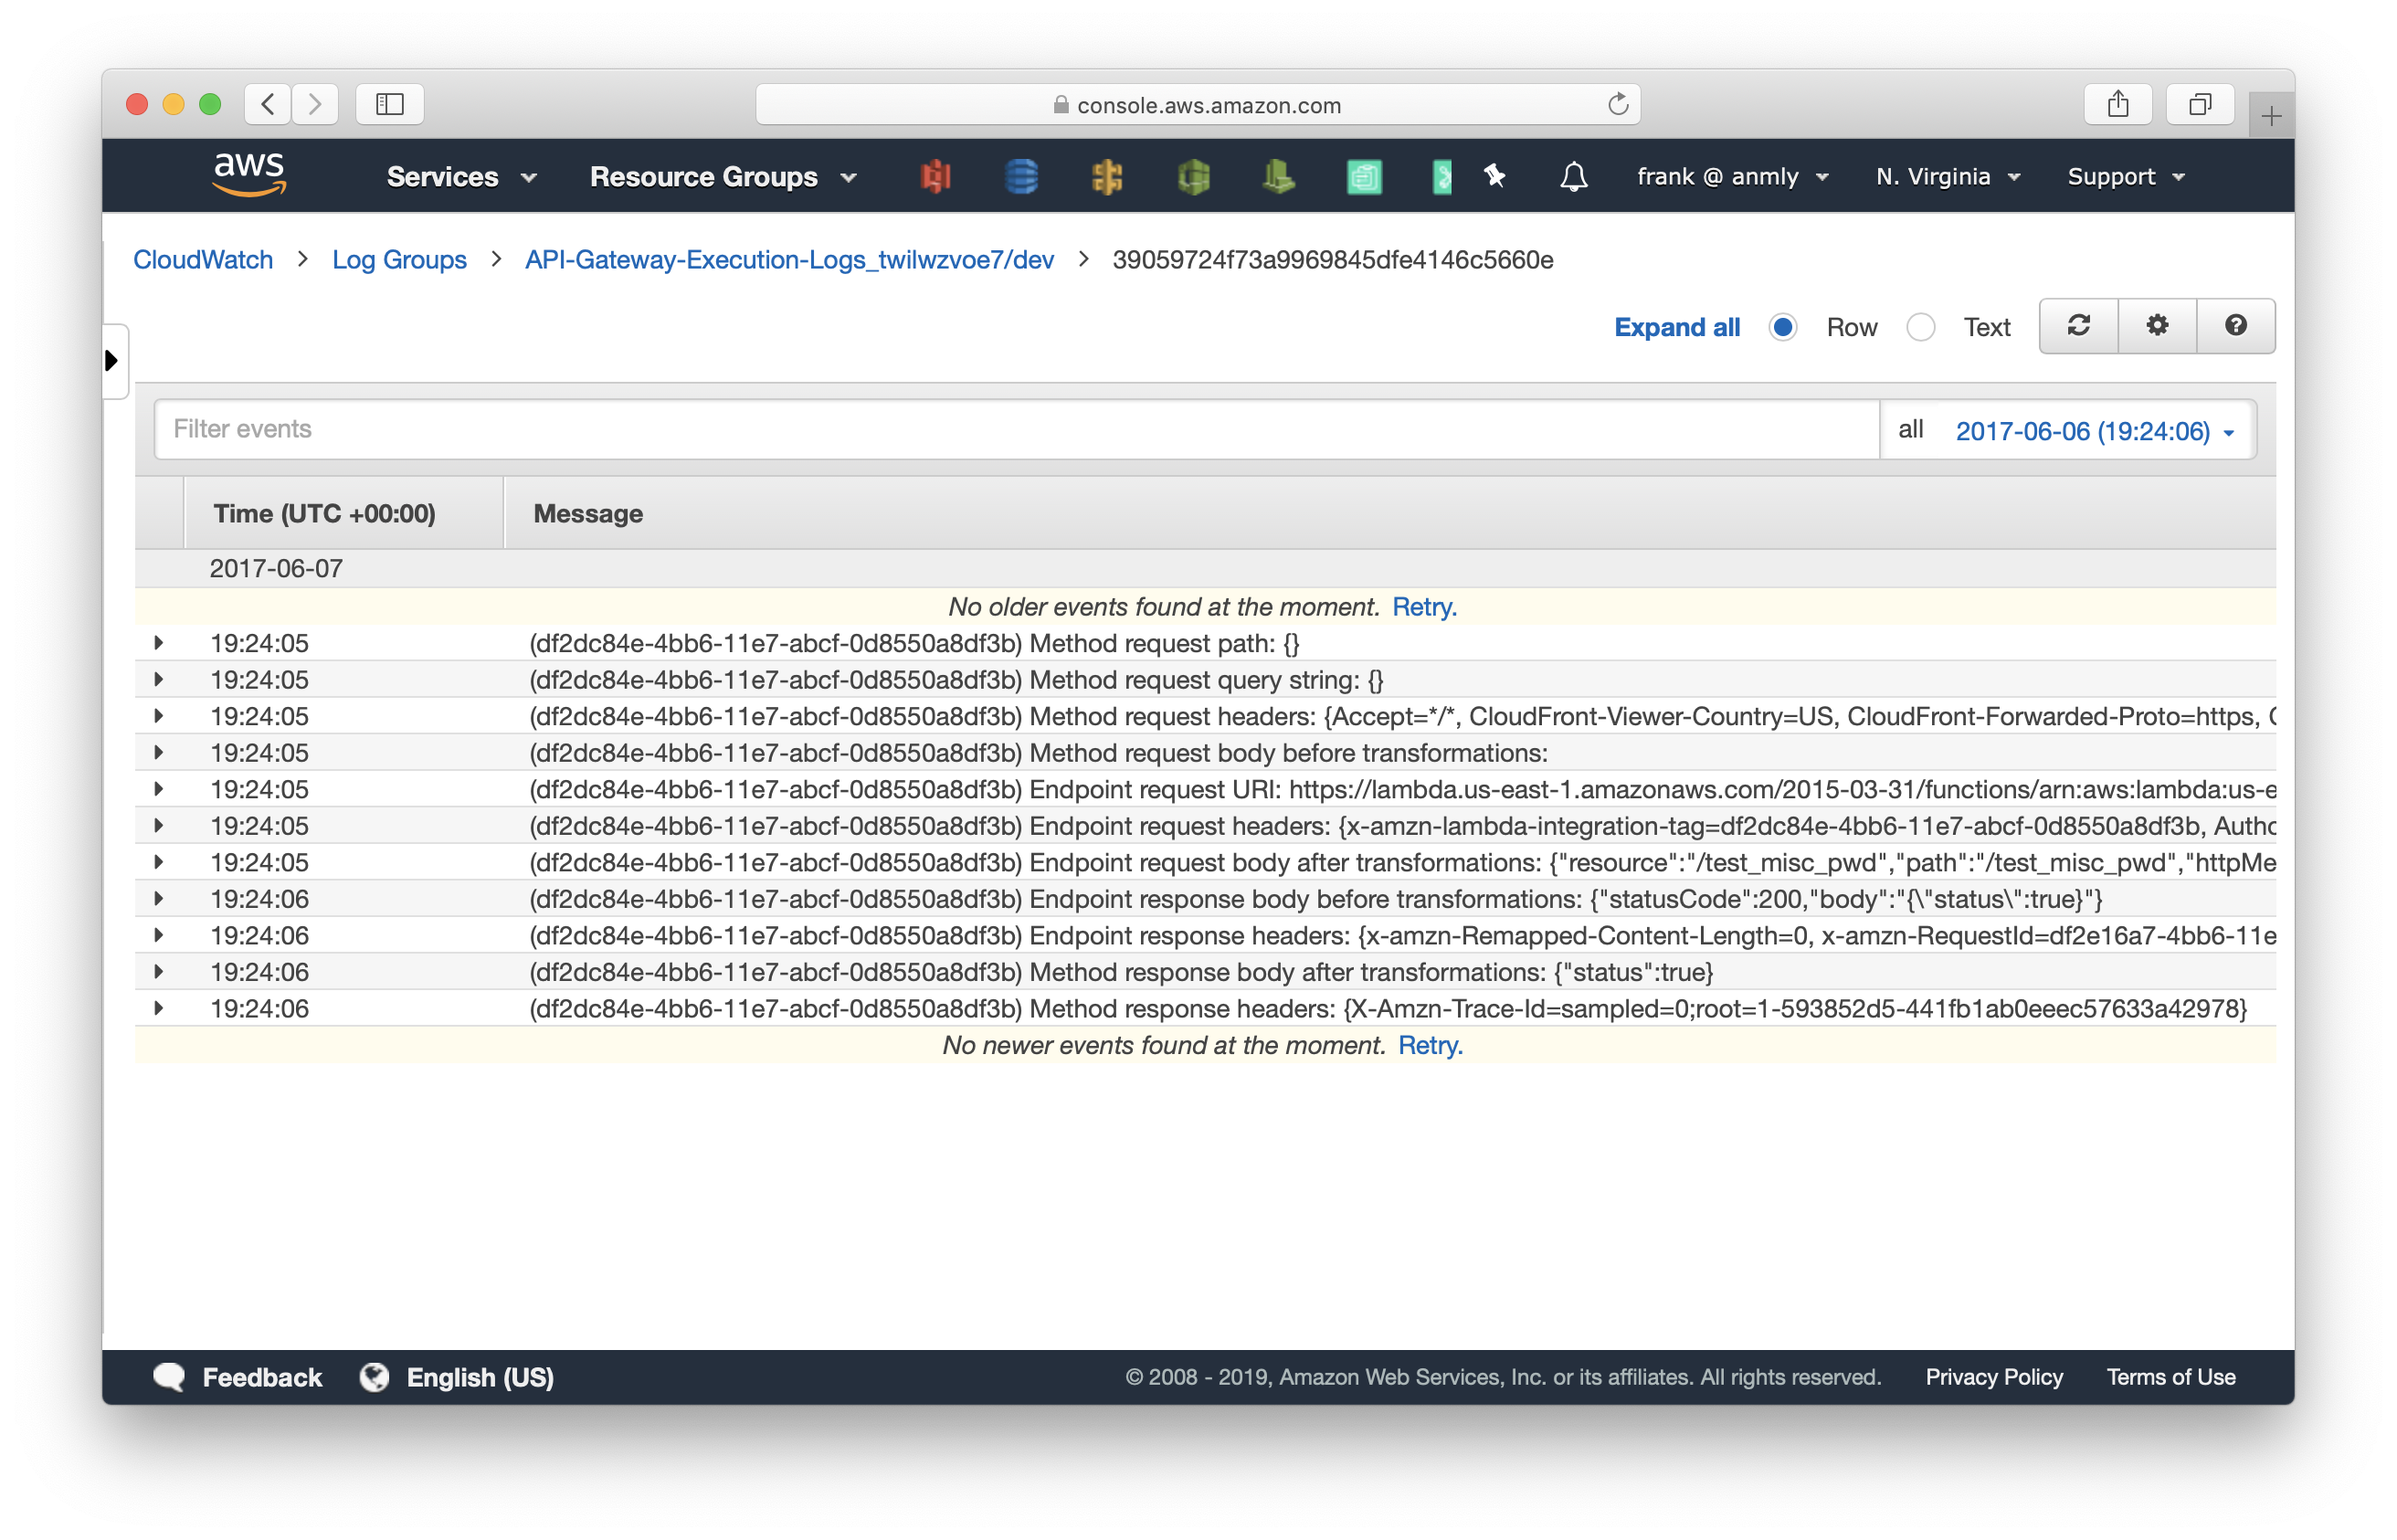
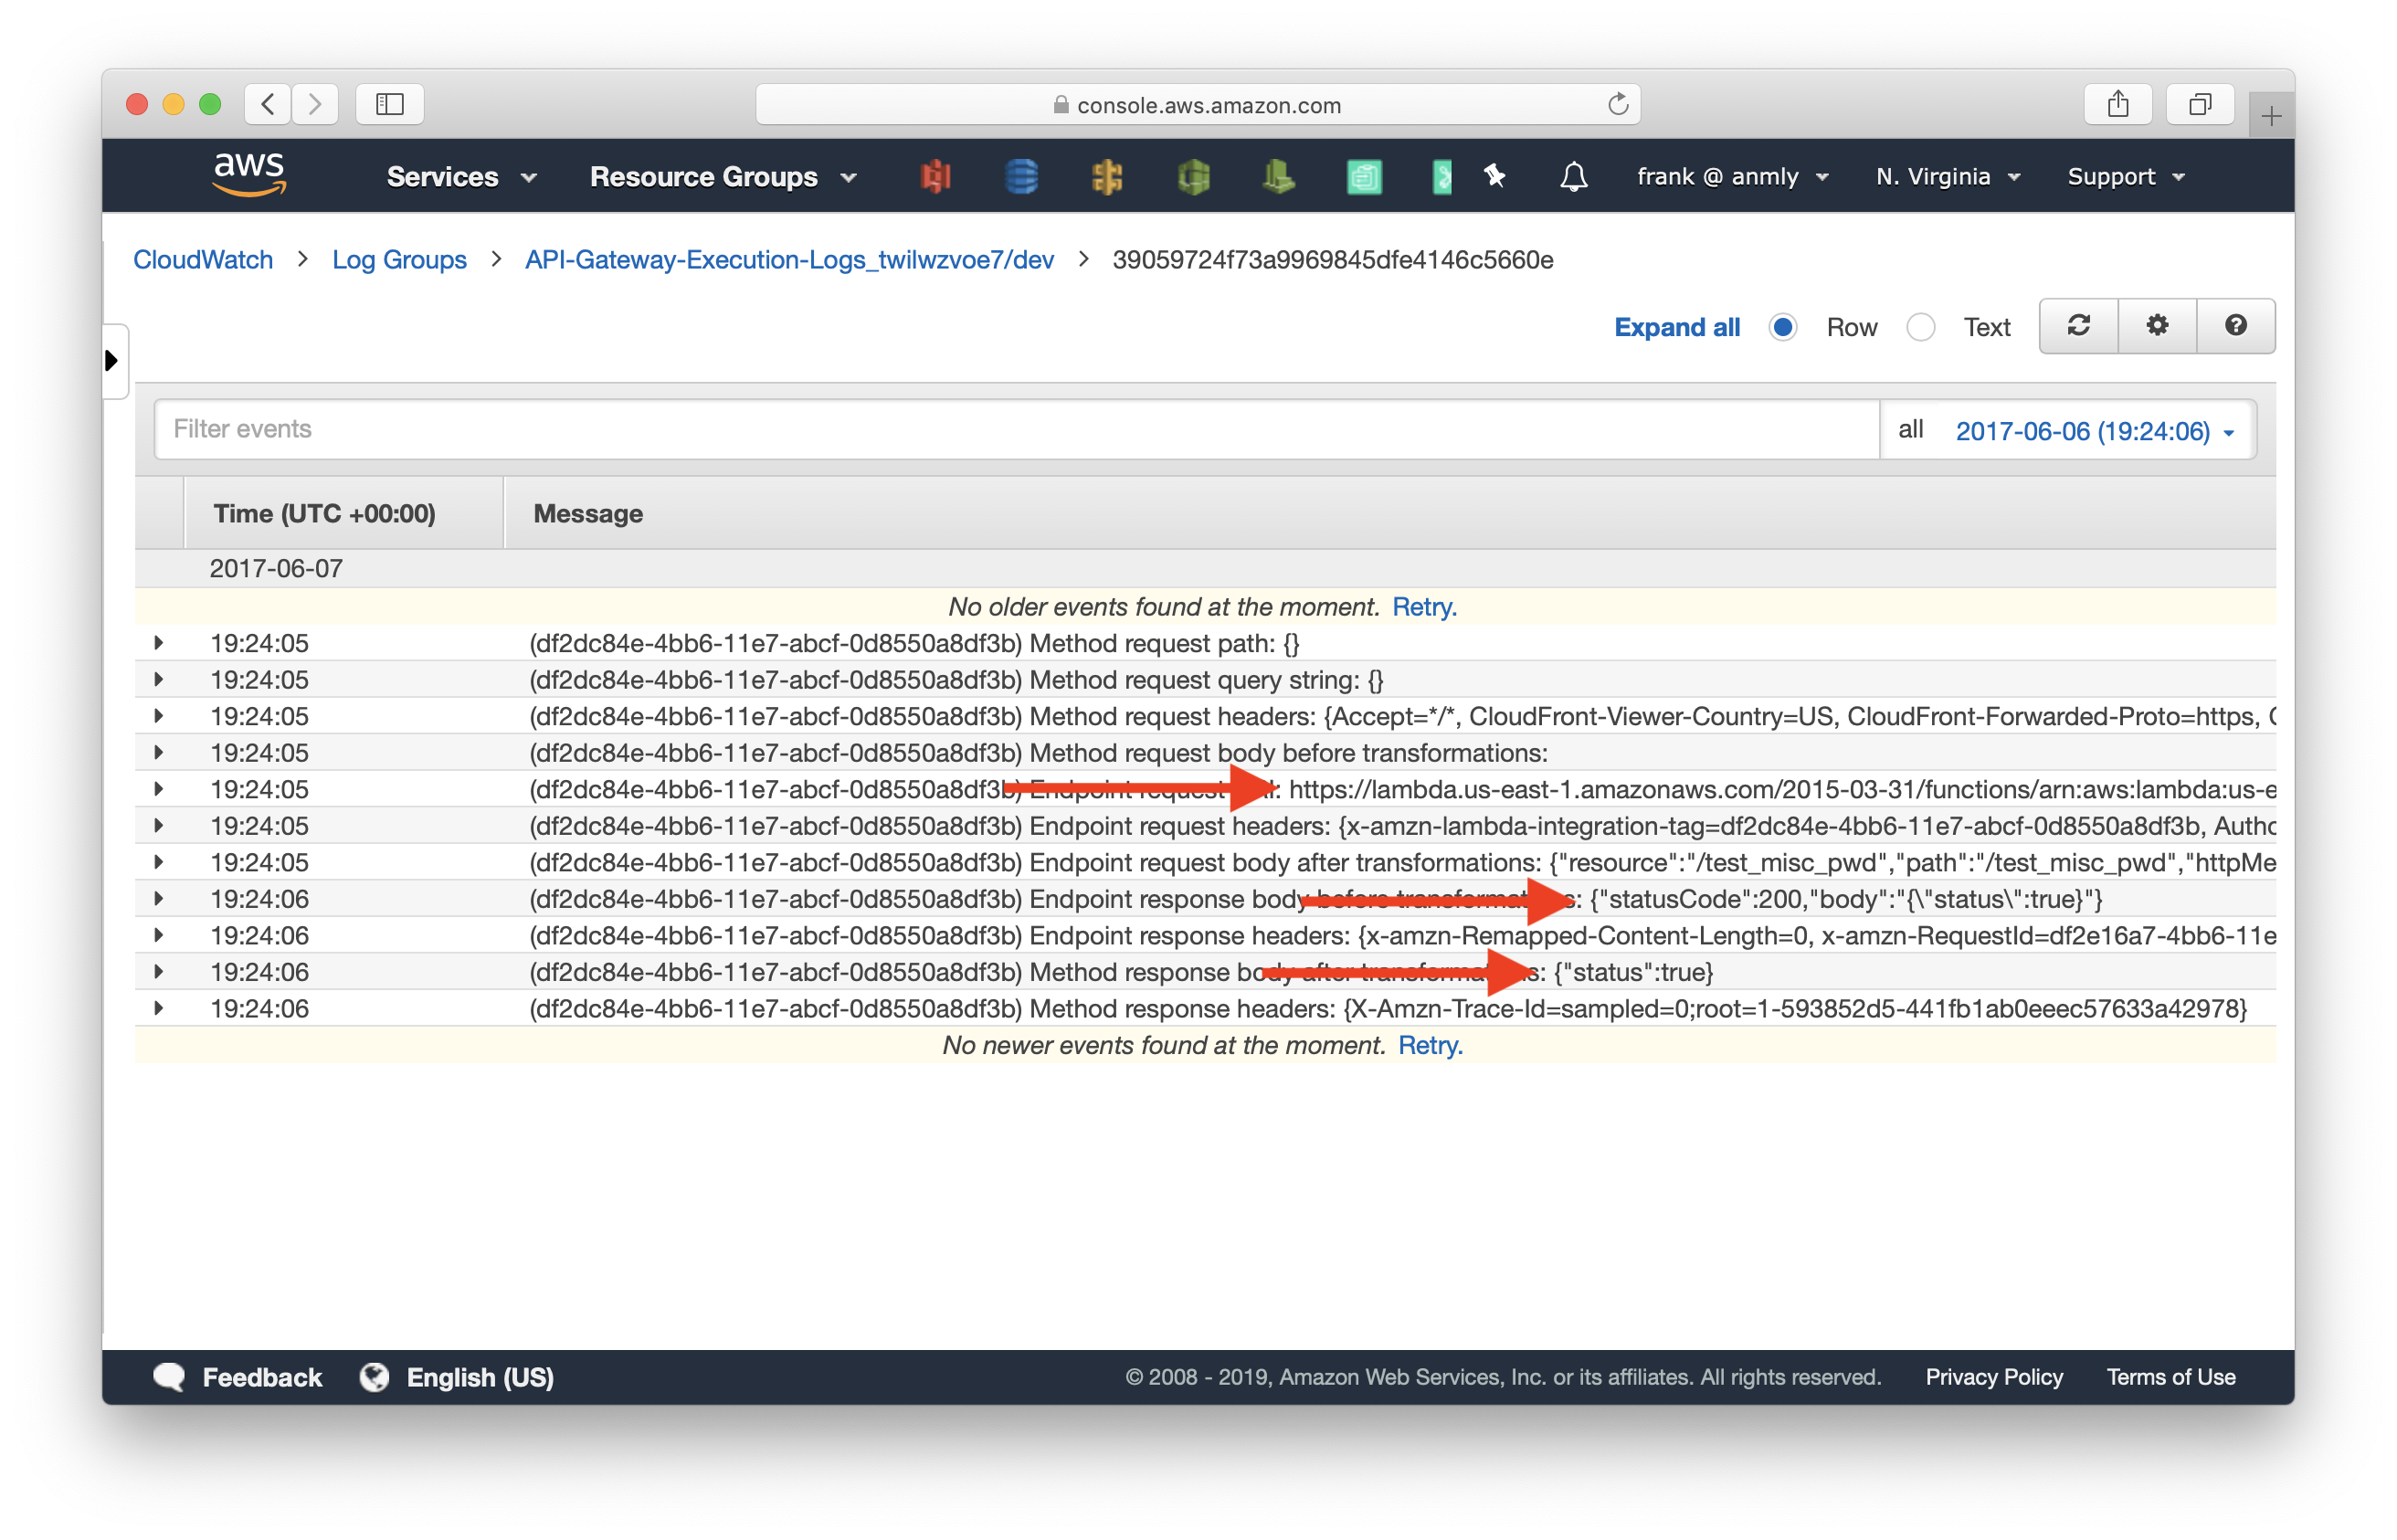
- The screenshot below shows log data for a single request. It contains:
- The request URL
- The request data received by API Gateway
- The request data sent to the Lambda function
- The response received from the Lambda function
- The response data sent by API Gateway
- The details on the usage plan, API key used to process the request, etc.
- Execution logs are useful when you need to debug a specific request and trace down the issue.
- Execution logs can generate lots of log data, and you could end up with a large CloudWatch bill.
So we recommend being selective while turning on execution logs. We have a post detailing how to do that here.
Access logs
- Access logs are logs of who has accessed your API. It’s similar to NGINX logs.
- They are managed by the developer.
- You are responsible for creating the CloudWatch log groups.
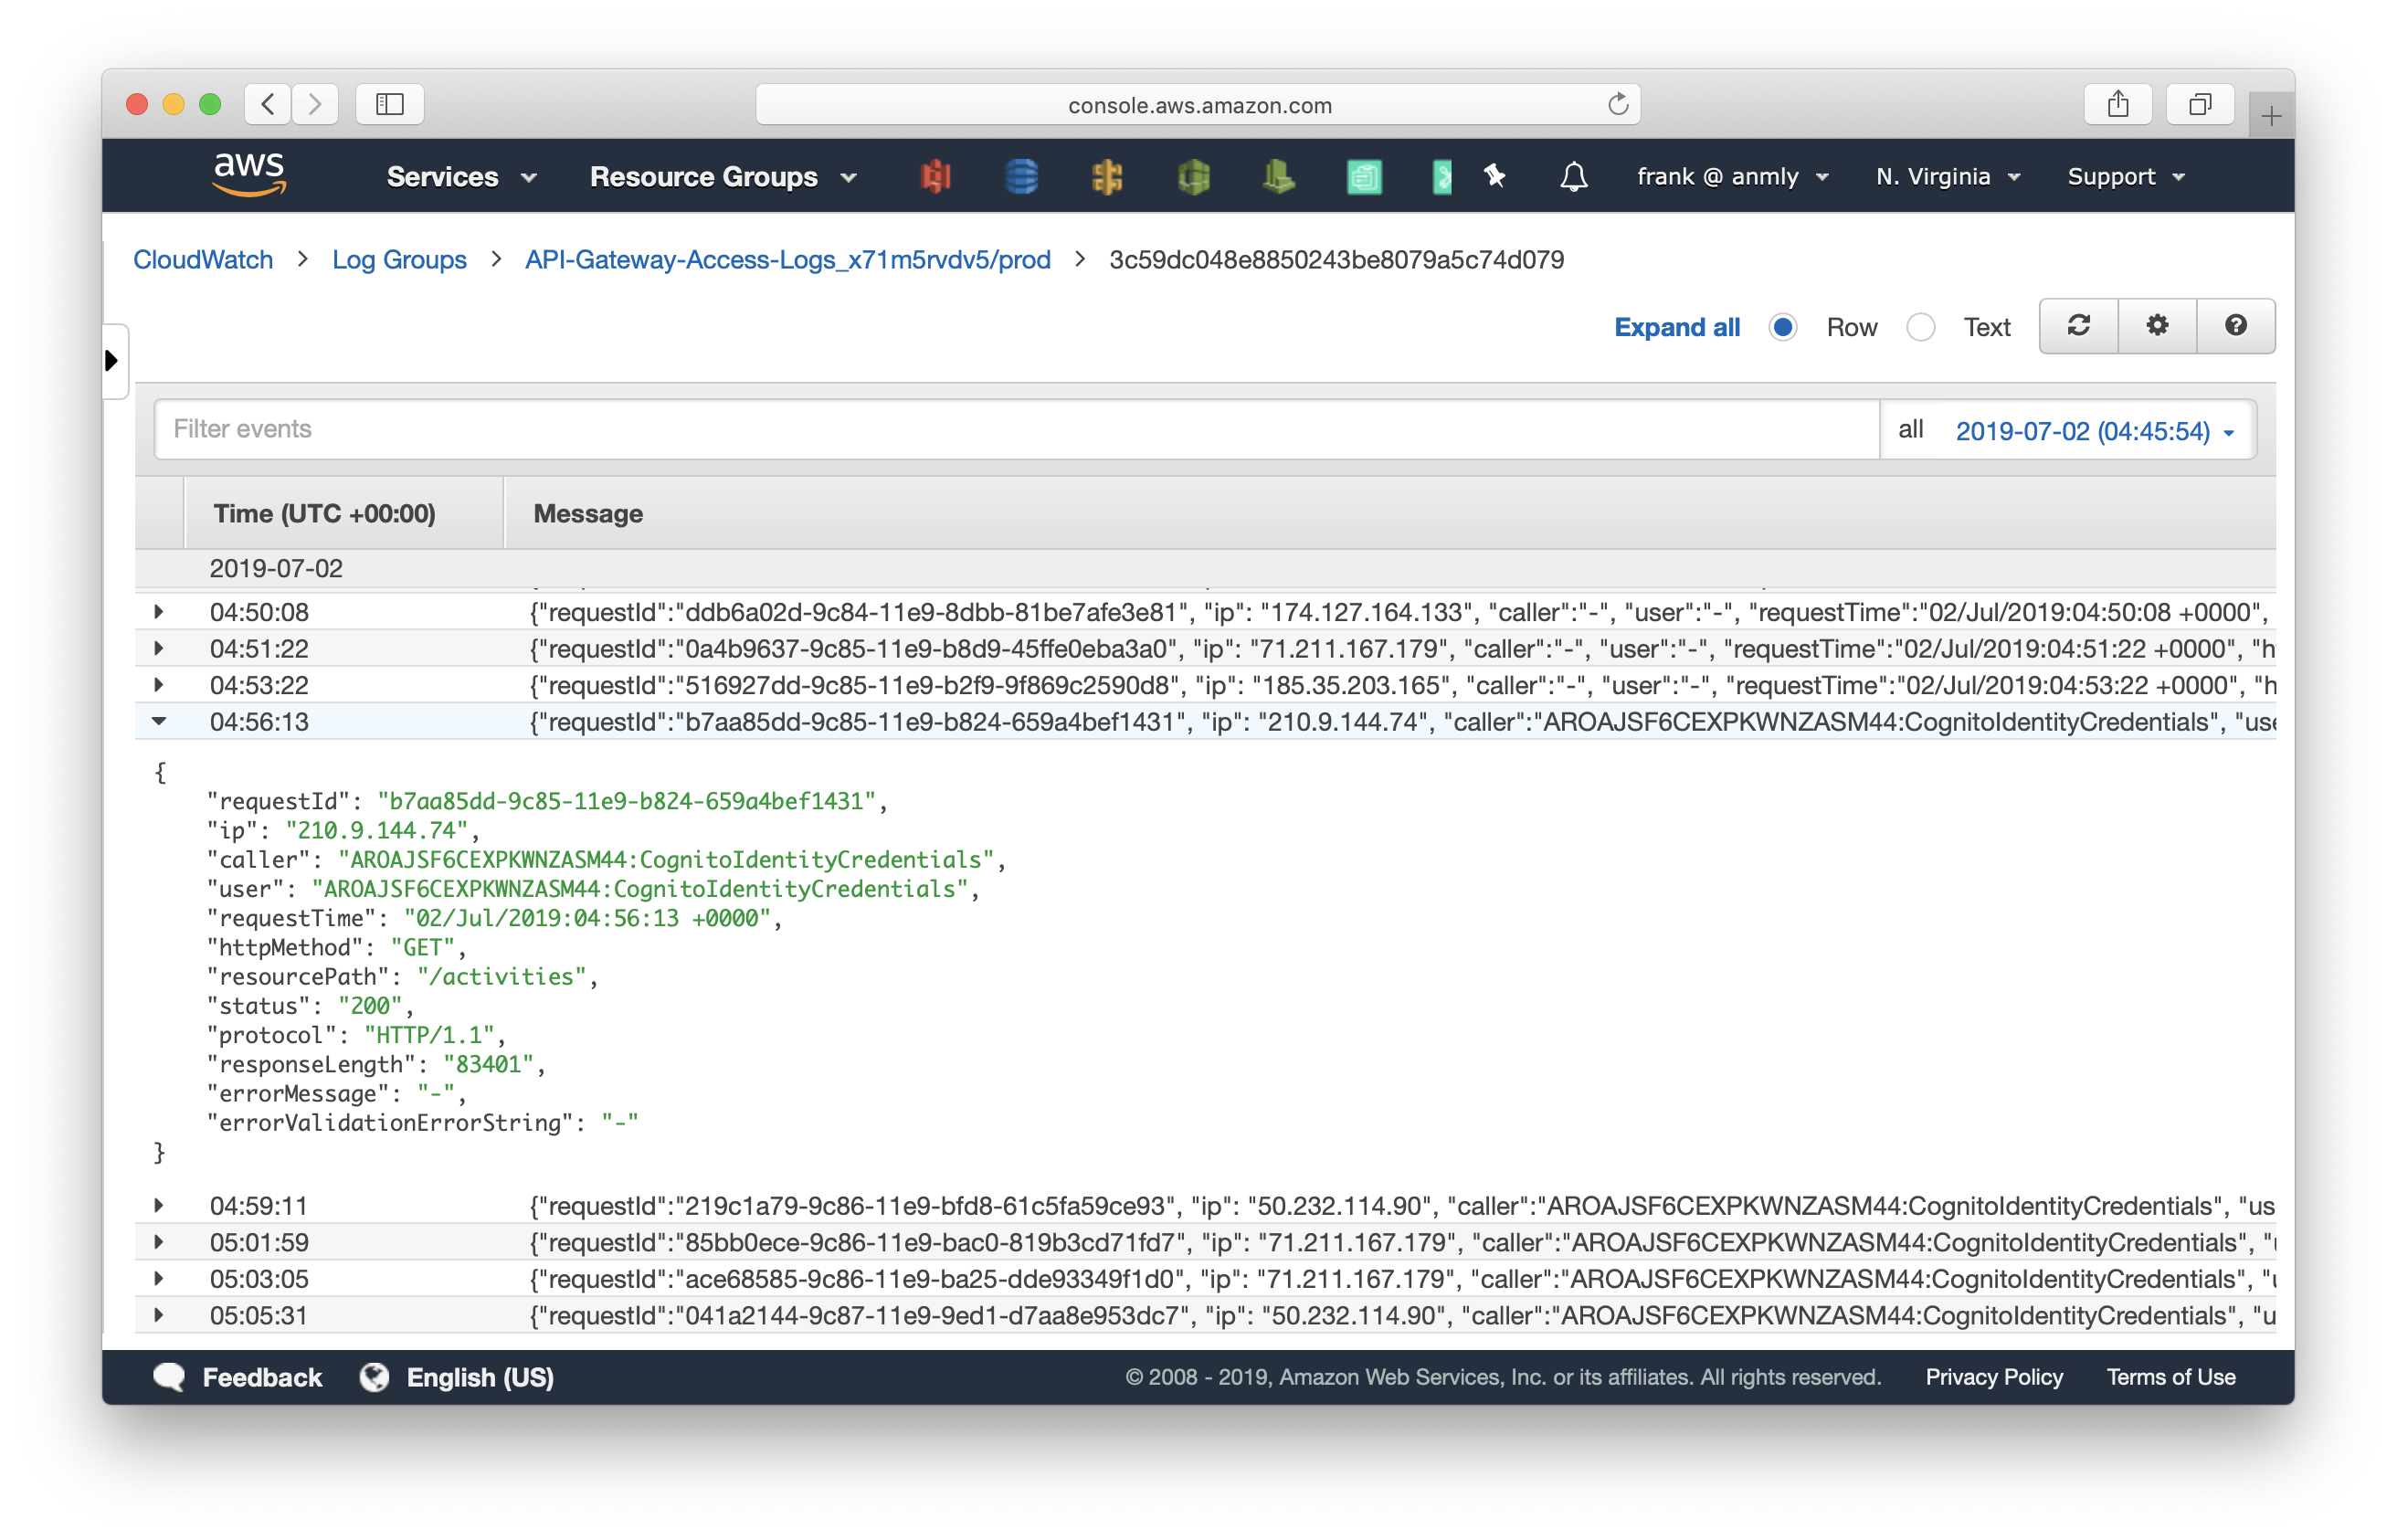
- You also define the log format. It can be CLF (Common Log Format), JSON, XML, CSV, etc.
- You have access to the data inside the
$contextvariable, including:- The caller’s IP address
- The request time
- The request HTTP method
- The request URL
- The response HTTP status code, etc.
- Access logs are useful for collecting analytical data about your API. You can feed these logs directly to your analytics services.
- Also, with CloudWatch insights, you can directly query against your access logs.
An example of the log format in JSON looks like:
{
  "requestId":"$context.requestId",
  "ip": "$context.identity.sourceIp",
  "caller":"$context.identity.caller",
  "user":"$context.identity.user",
  "requestTime":"$context.requestTime",
  "httpMethod":"$context.httpMethod",
  "resourcePath":"$context.resourcePath",
  "status":"$context.status",
  "protocol":"$context.protocol",
  "responseLength":"$context.responseLength"
}
We recommend keeping your access logs turned on. It’ll come in handy when you need to look up some information retroactively. This is similar to the web server logs from your pre-serverless days. We have a detailed post on how to turn on your access logs here.
Do your Serverless deployments take too long? Incremental deploys in Seed can speed it up 100x!
Learn More