New and Improved Serverless Metrics
Following on the heels of the recent update to our logs viewer; we are excited to announce a complete redesign to how Seed displays your Lambda and API metrics.
We’ve made a couple of key improvements. Let’s go over them really quickly.
1. Fast navigation and lookup
Now you can easily navigate to view the metrics for a Lambda function or API endpoint by simply typing in a few keywords. The filter we use to help you look up logs now also works for metrics as well!
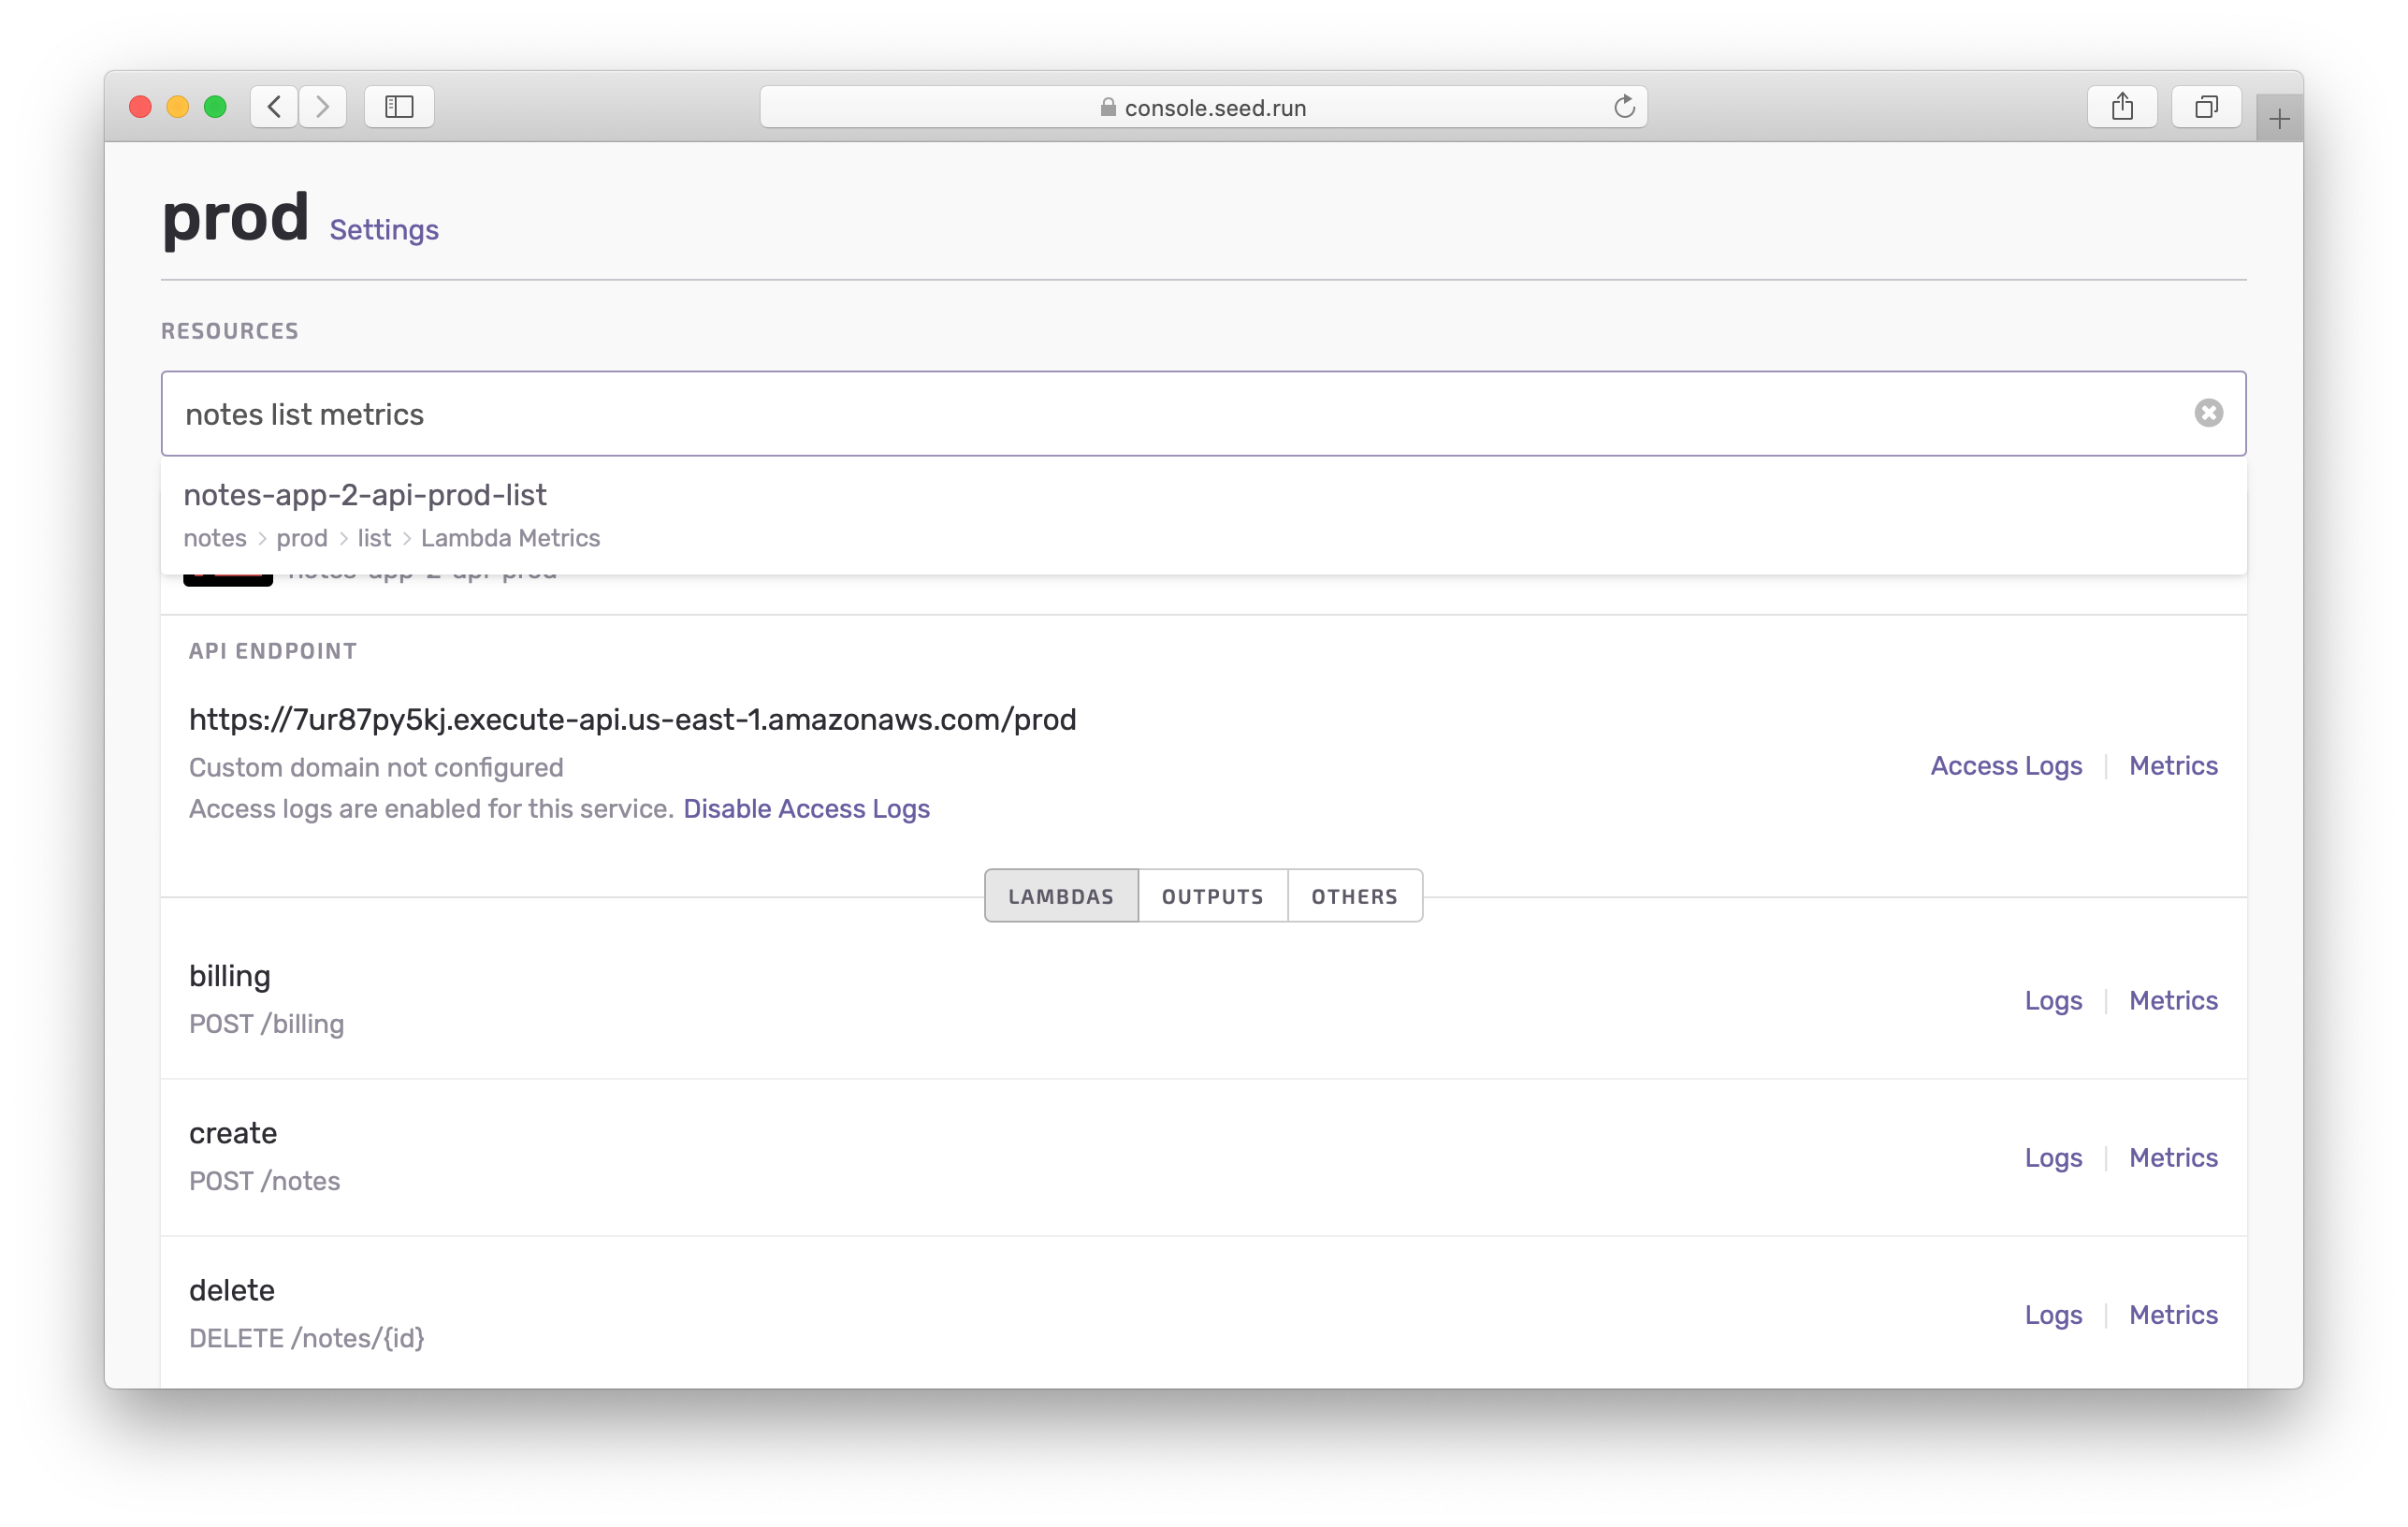
Also, Seed will keep track of your recent searches.
2. Inspect logs for a data point
The biggest improvement that comes with this update is the ability to inspect your metrics. You can now click on a data point to view the logs associated with it.
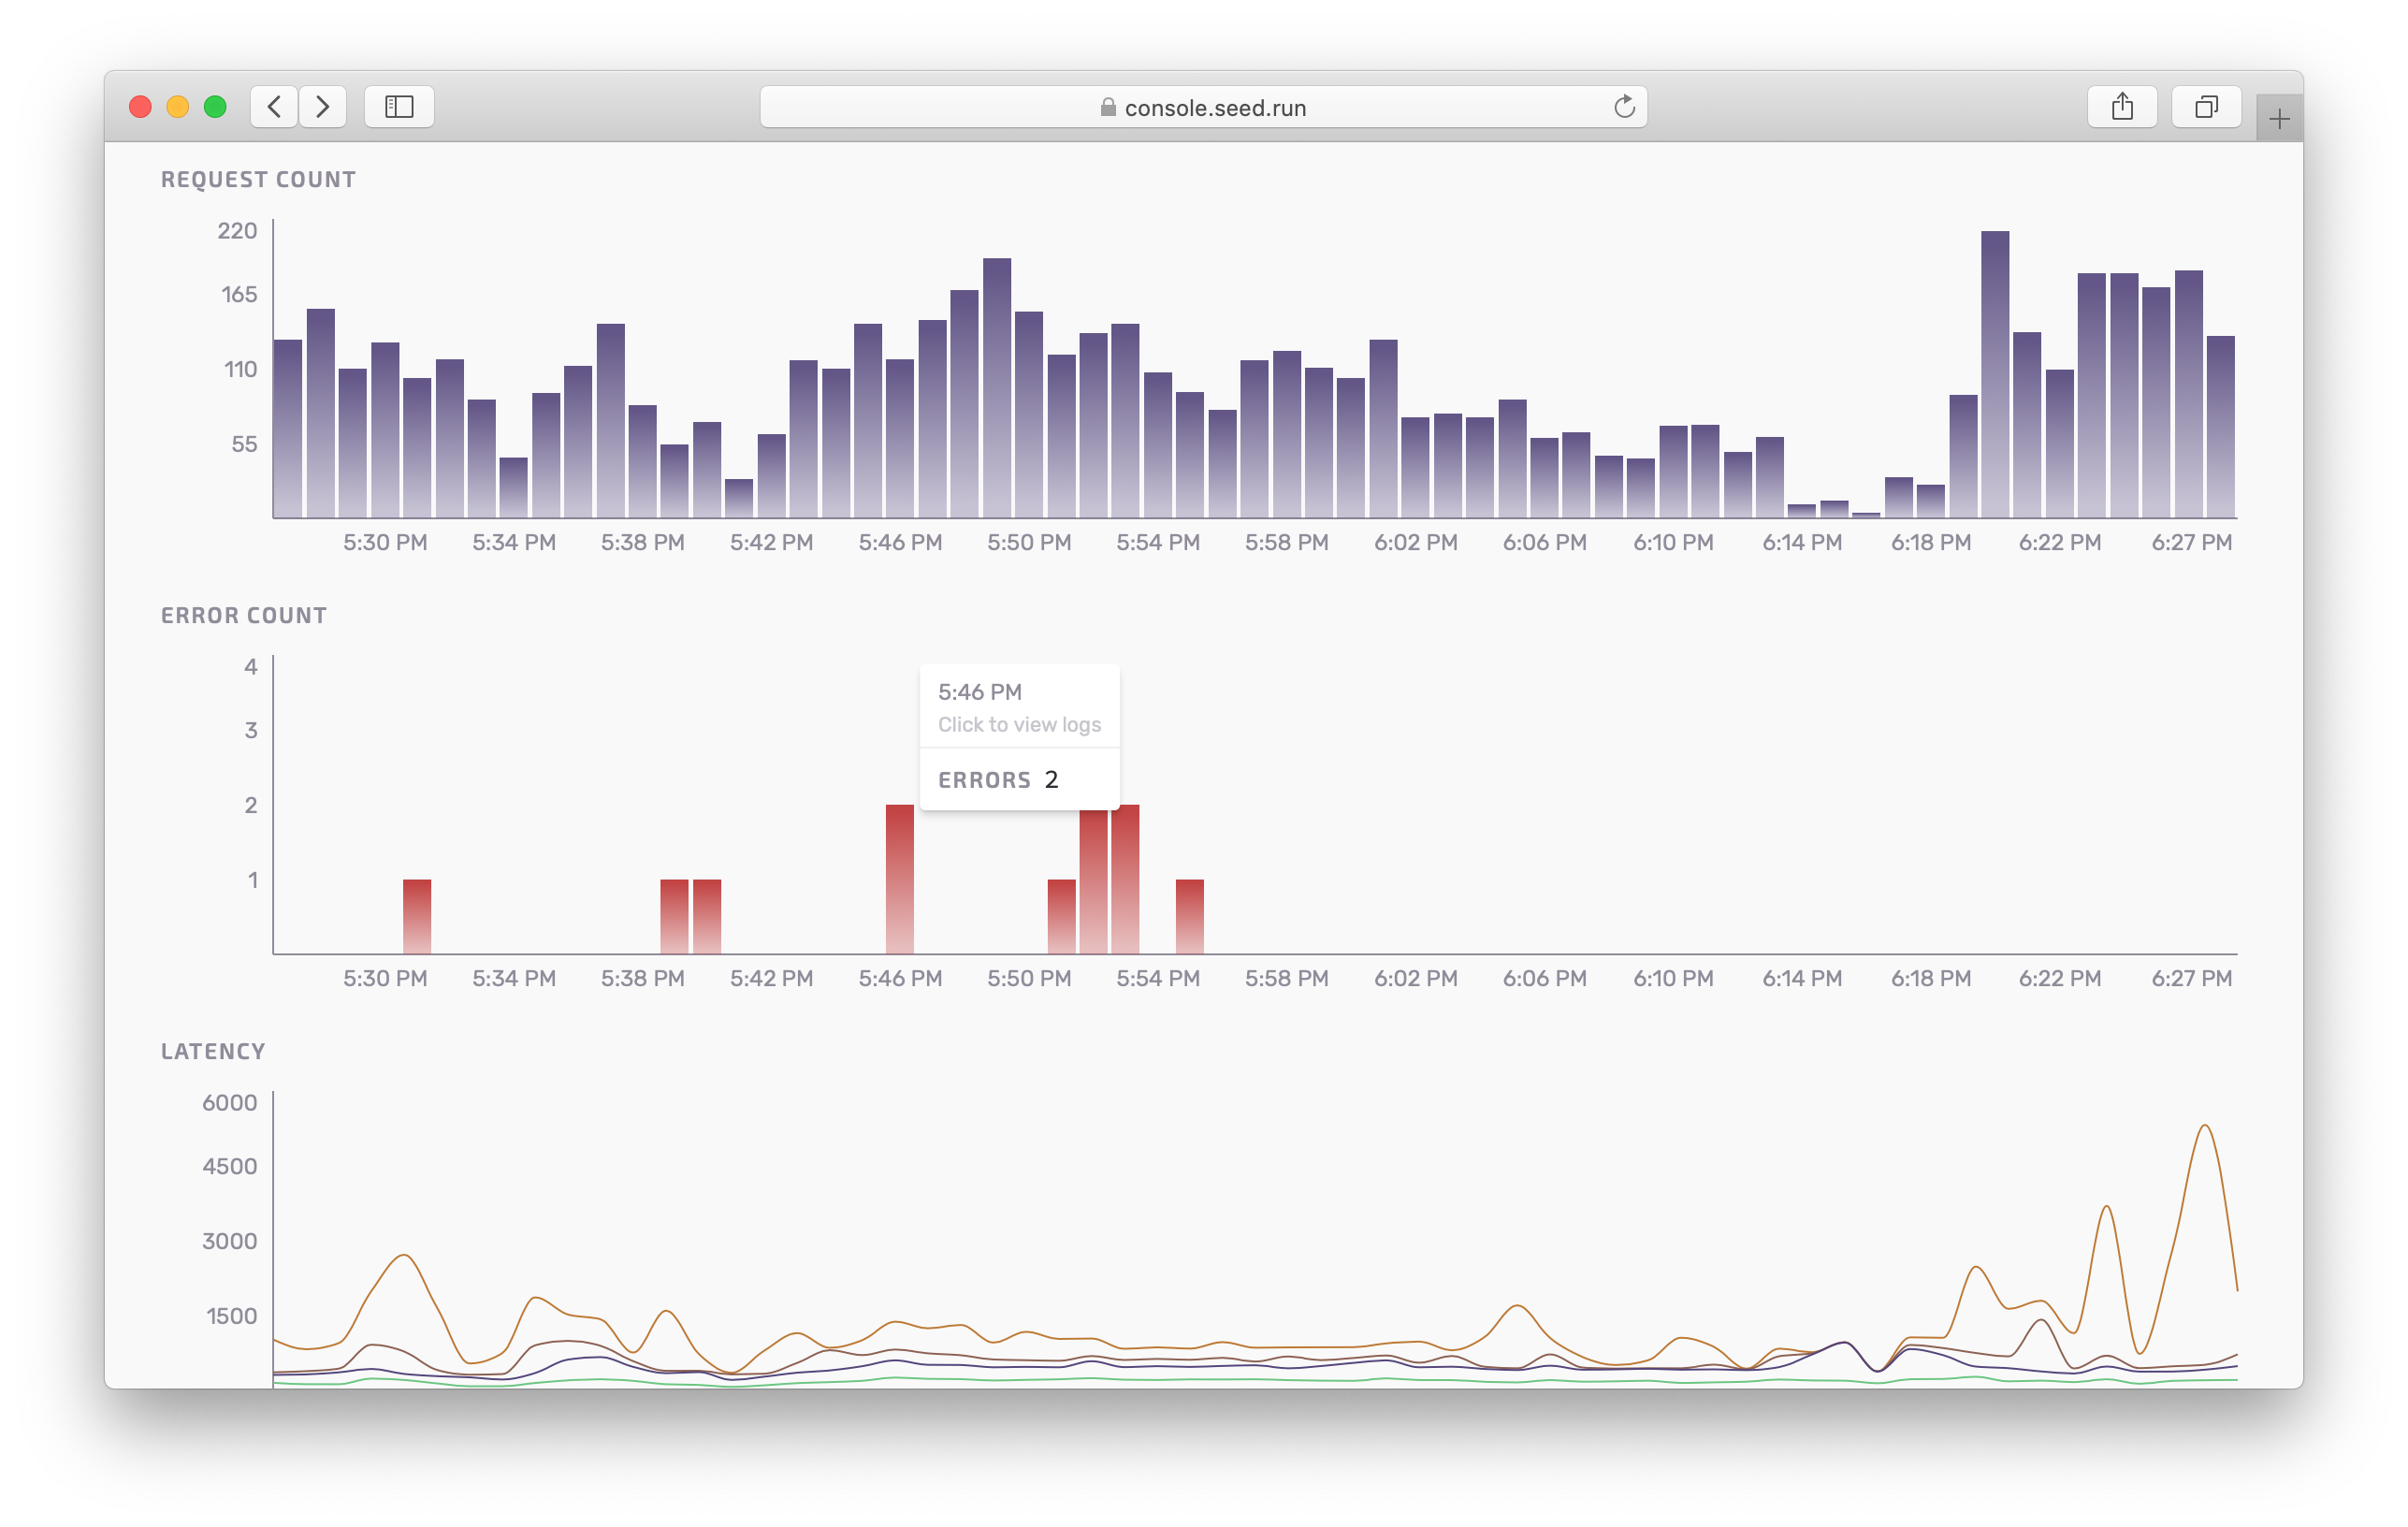
This comes in really handy when debugging Lambda or API errors.
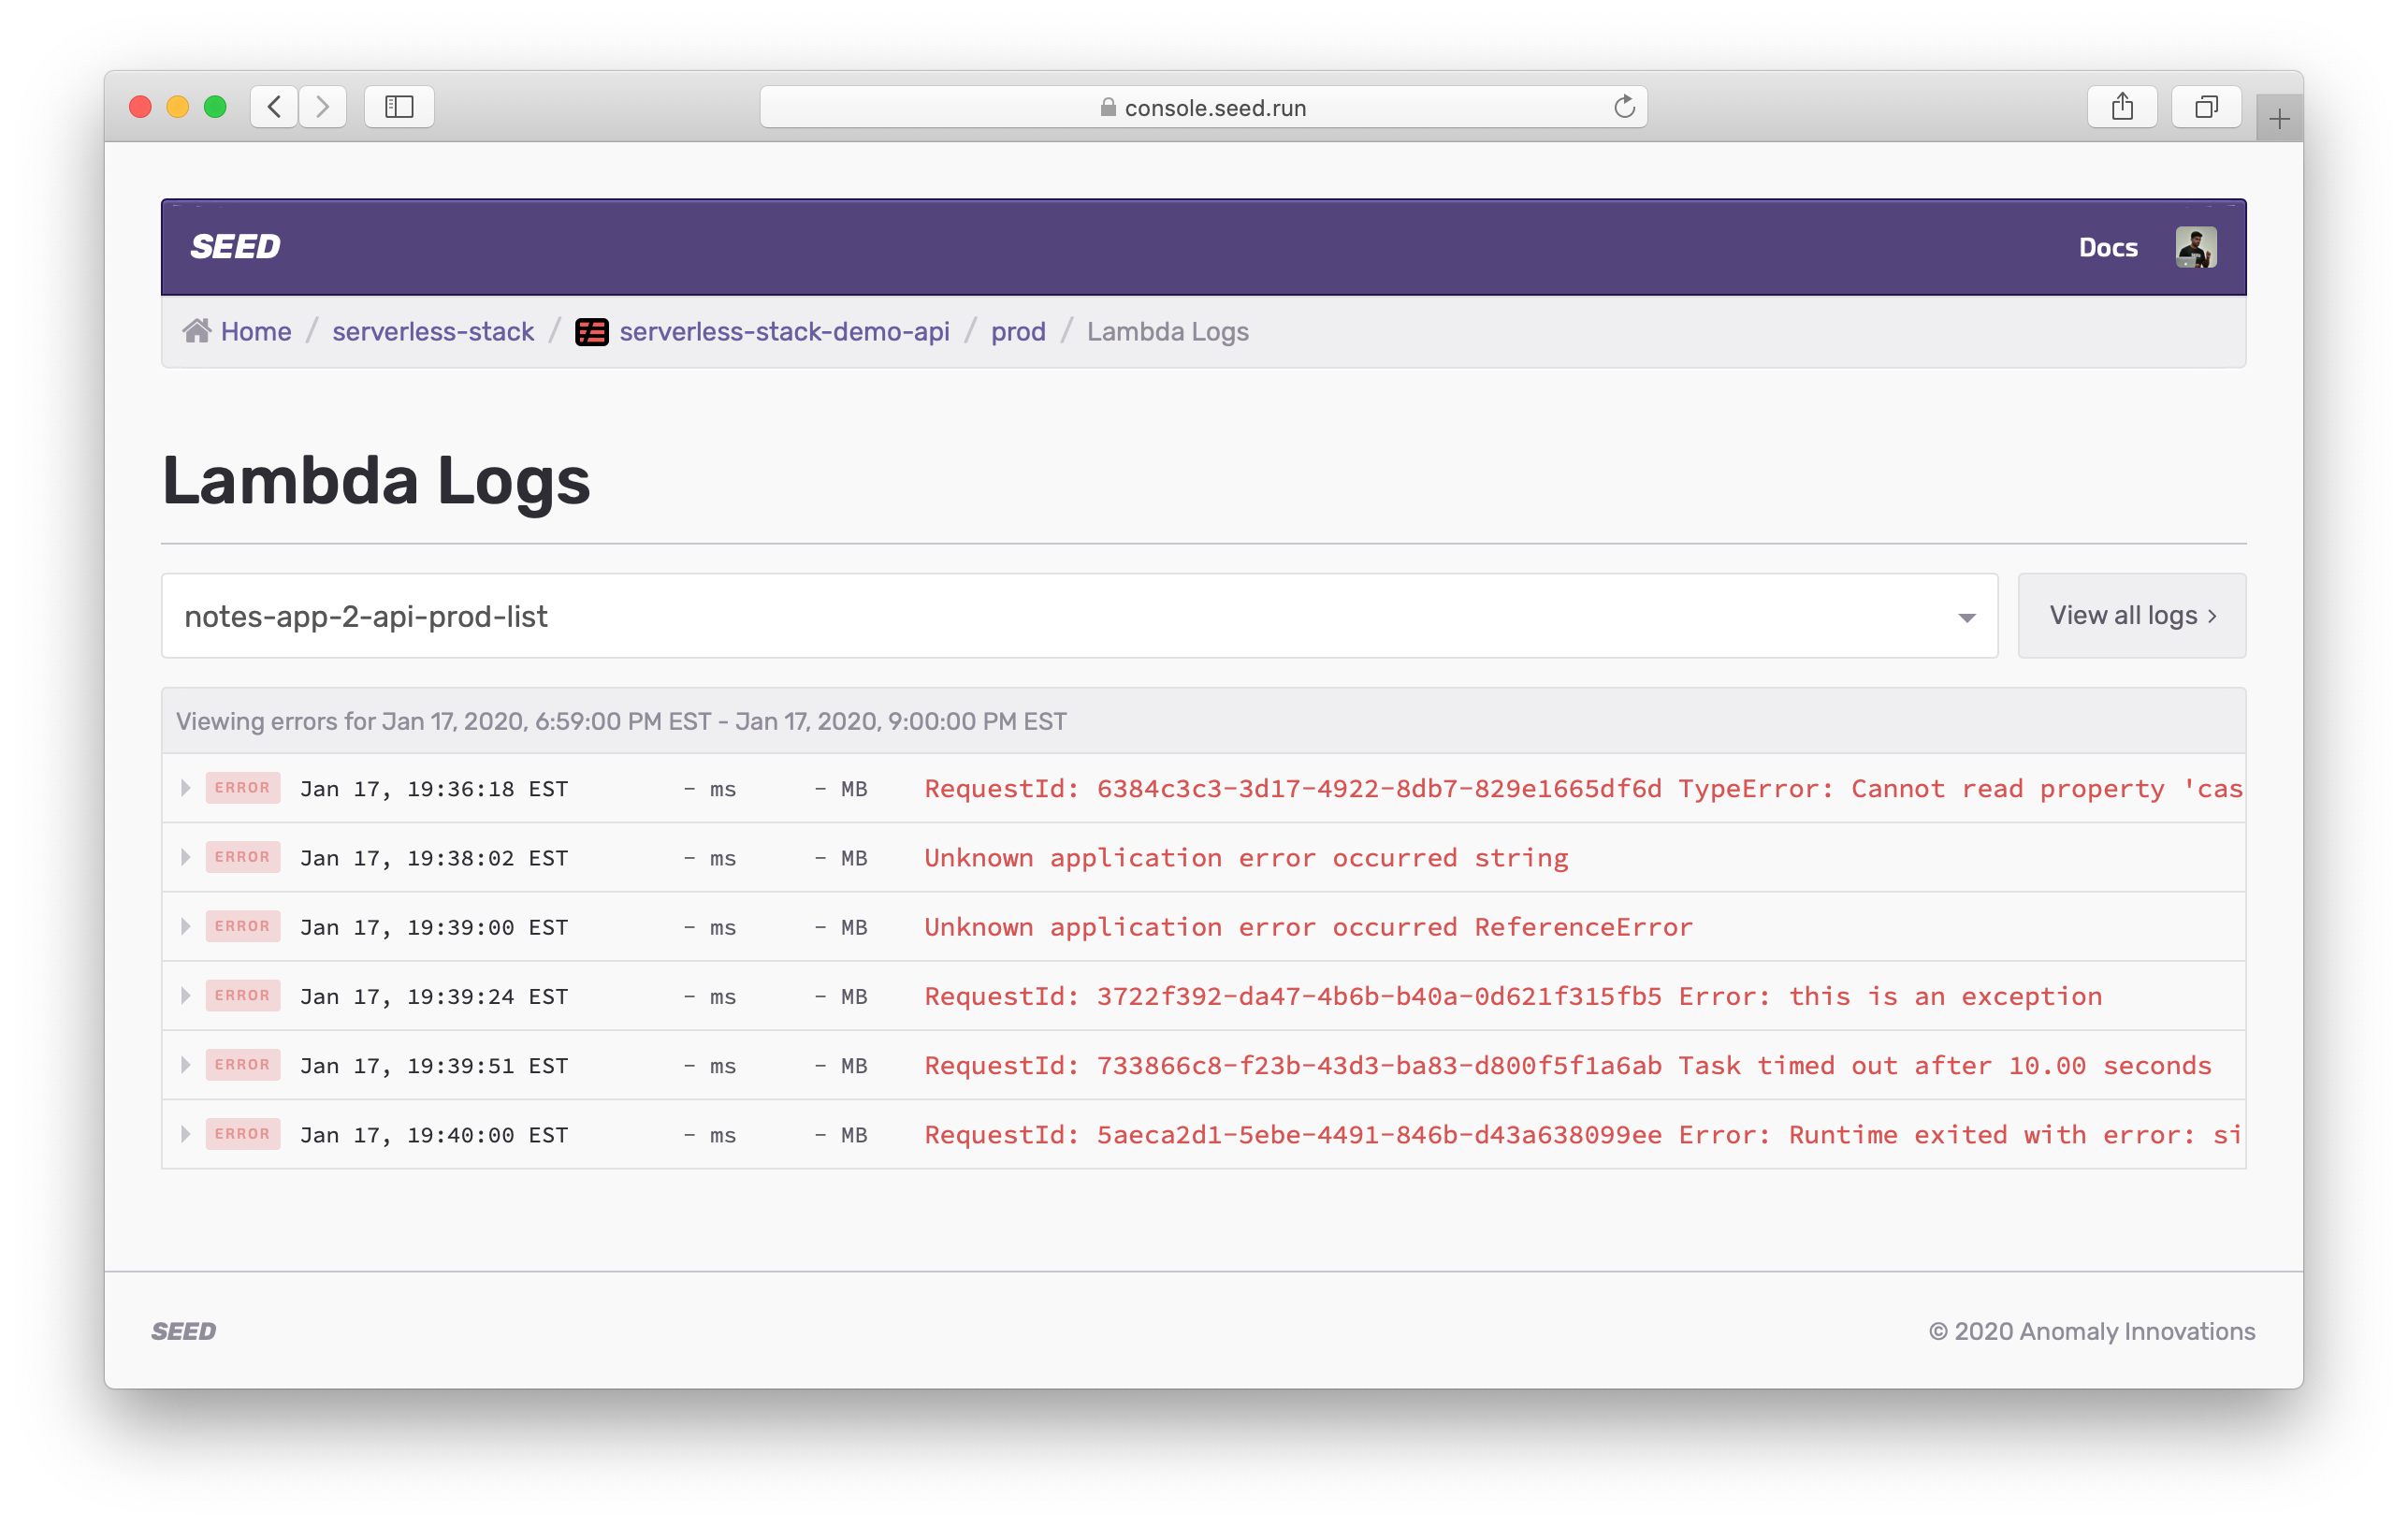
3. View all Lambda errors
You might be using a service like Sentry for error reporting in your Lambda functions. However, this only reports the errors that can be caught inside your Lambda function. This does not include the following types of errors:
- Out of memory
- Time out
- Errors before initialization
- Before handler
- Syntax errors
- Handler file/function not found
The errors reported in the metrics account for the above. This combined with the ability to inspect the logs for a data point on the graph, allows you to get a more comprehensive view of the errors your users are encountering.
Note that, any errors related to IAM permissions might show up in the metrics but not in the related logs. Check out the docs for further details.
4. Filter by time
Finally, just like in our logs viewer, we make it really easy to look up the metrics for a given time or time range. By default, Seed will show you the live metrics from the last hour. But you can simply put in a specific time, timestamp, or range.
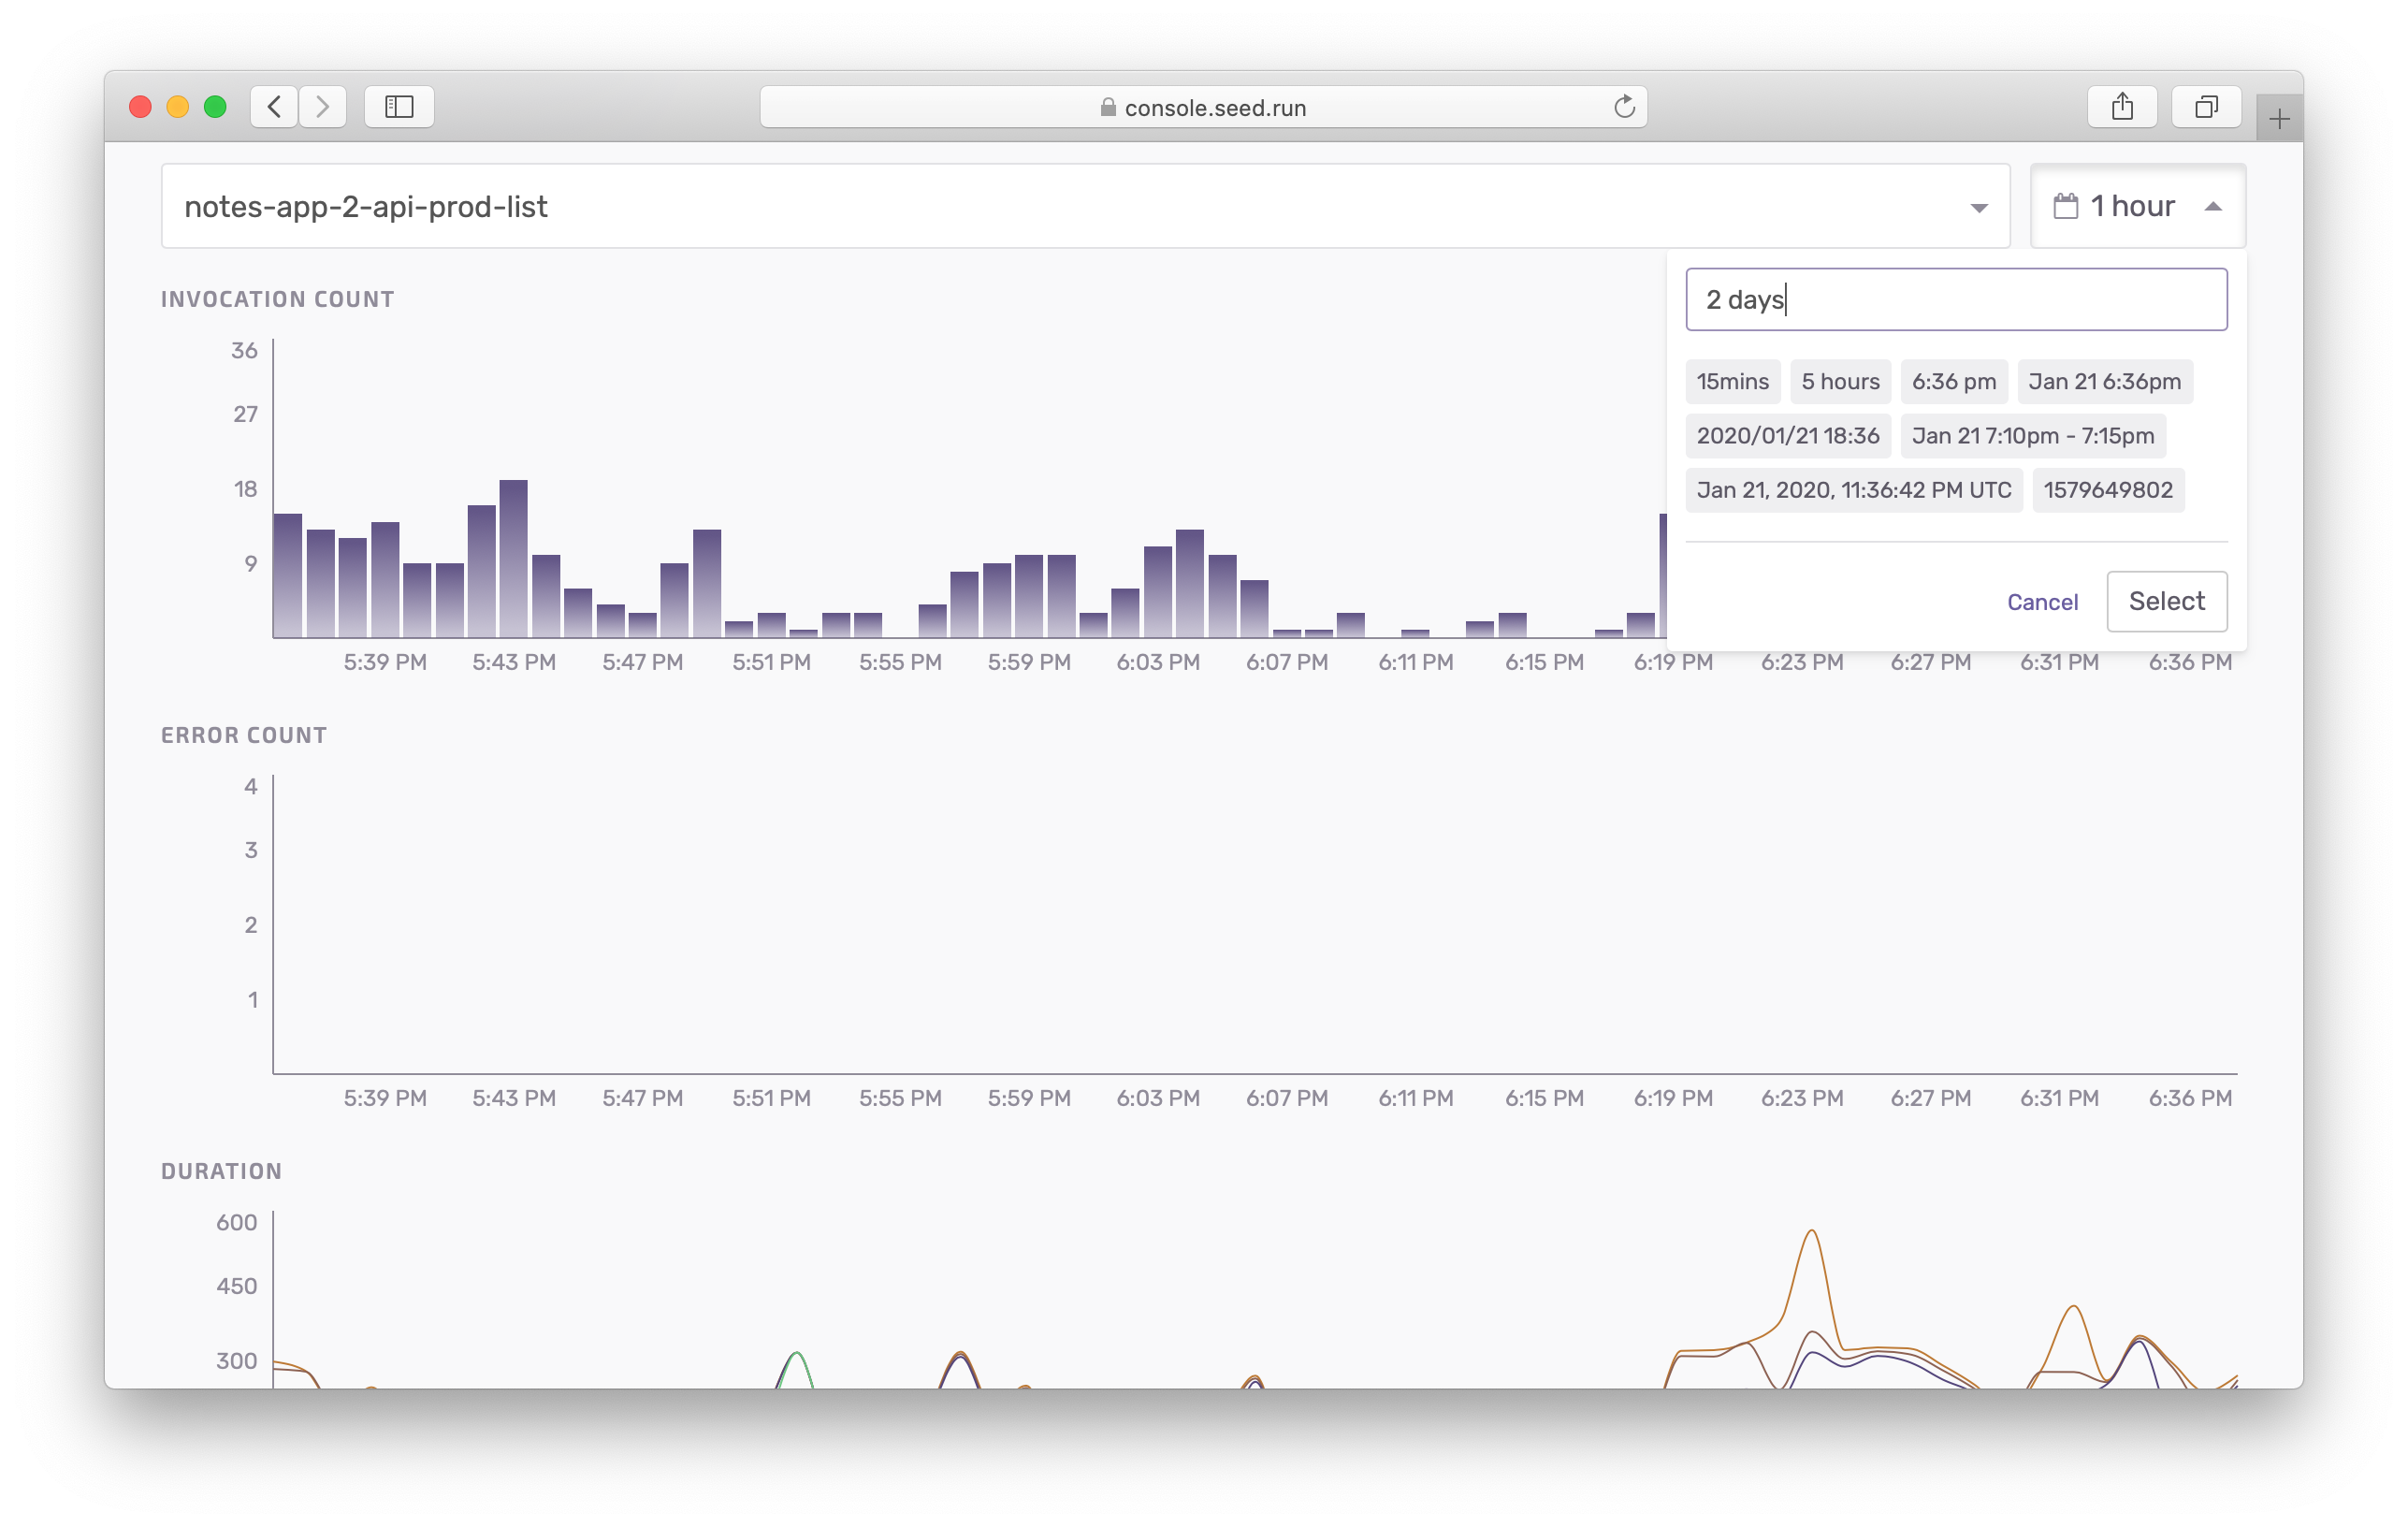
And it supports multiple timezones as well!
Notes
The new metrics is based on CloudWatch Metrics. This means that:
-
It is available to all Seed users.
-
This means that you get unlimited log retention!
-
There is a really small cost attached for displaying the metrics ($0.01 per 1,000 metrics requested dependent on the region). Make sure to check out the pricing details here.
-
Viewing the error logs for a data point is supported only for Node.js and Python currently.
Summary
We know that working with logs and debugging errors has been a huge pain point for Serverless developers everywhere. We hope that this new metrics update and the logs viewer can help with that! Also make sure to check out our docs on viewing metrics and viewing logs.
Do your Serverless deployments take too long? Incremental deploys in Seed can speed it up 100x!
Learn More