Viewing Logs
Seed makes it very easy to monitor your deployments by giving you a live look at your API Gateway Access Logs and Lambda Logs. This allows you to monitor your deployments and decide if you need to rollback in case of an error.
A couple of quick notes about the log viewer in Seed:
- Seed internally uses CloudWatch Logs and Logs Insight queries.
- This means that you get unlimited log retention!
- Viewing your logs live is completely free.
- However, AWS will charge you based on the amount of logs that are queried. When you filter your logs you are charged $0.005 per GB of log data scanned (depending on your region). So if you are querying large production apps, it’s important to be aware that there is a cost. Make sure to check the CloudWatch Analyze (Logs Insights queries) pricing for your region.
- We also need a couple of additional permissions to connect to CloudWatch in your account. More on this below.
Lambda Logs
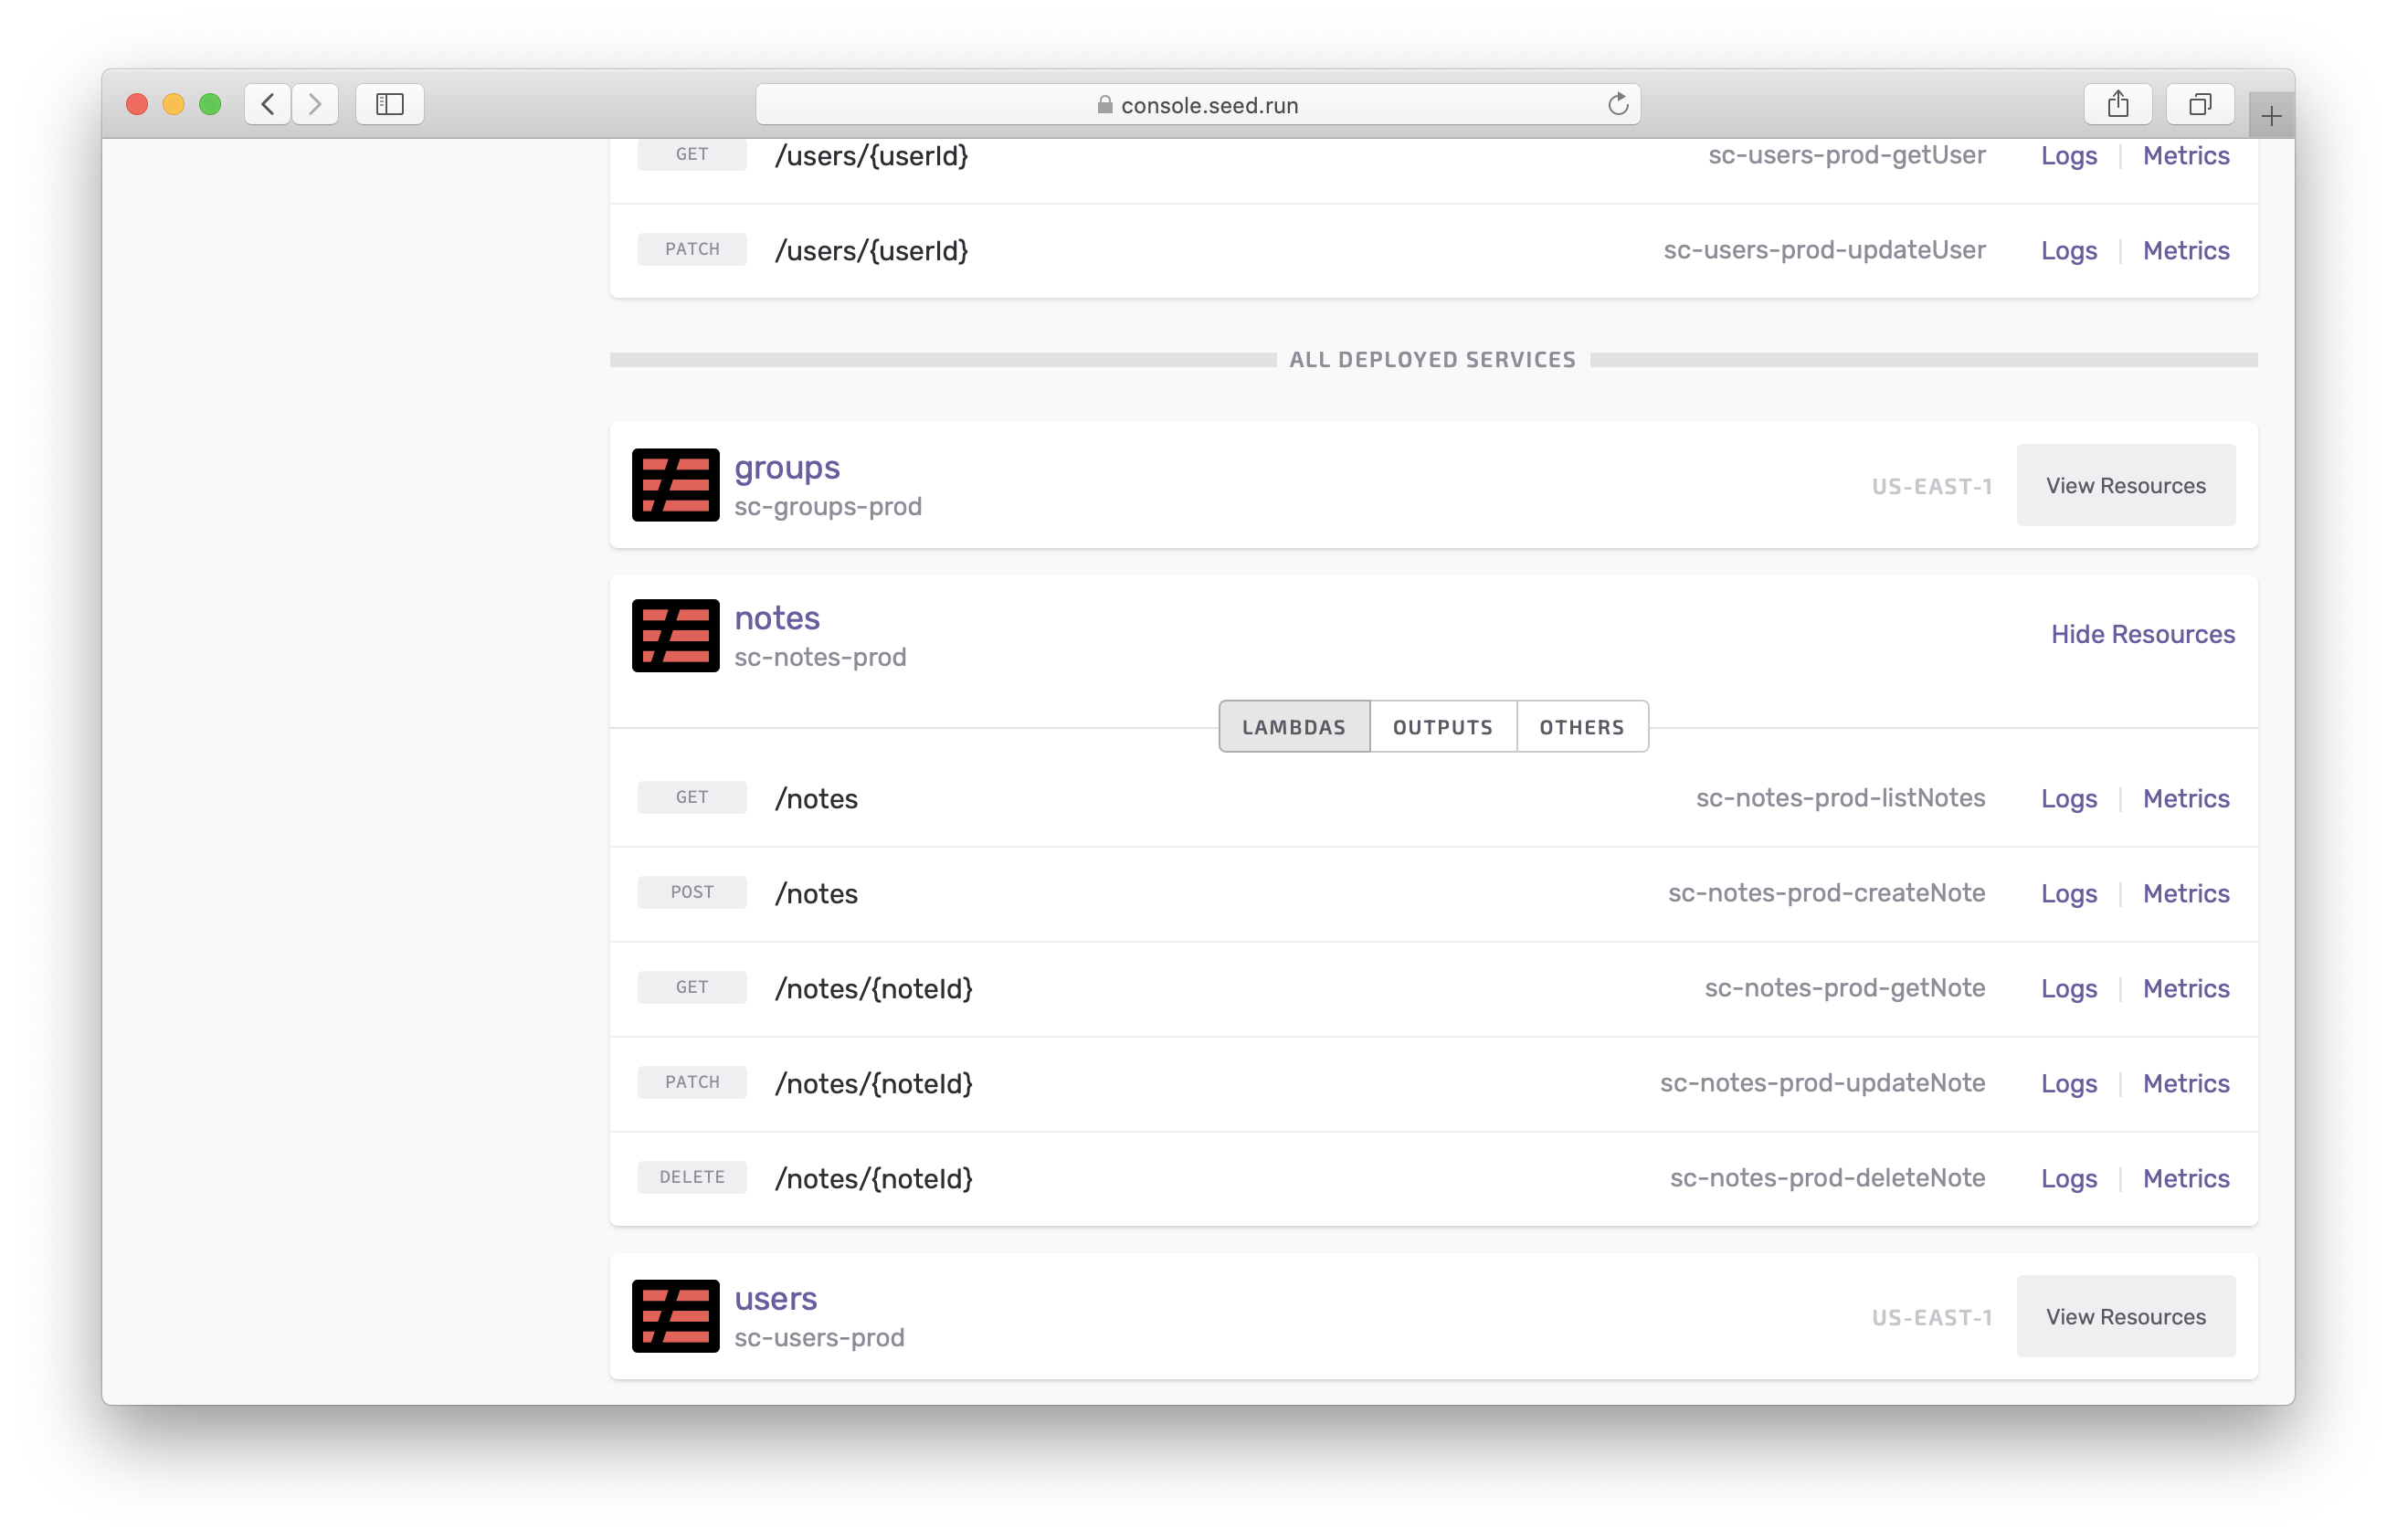
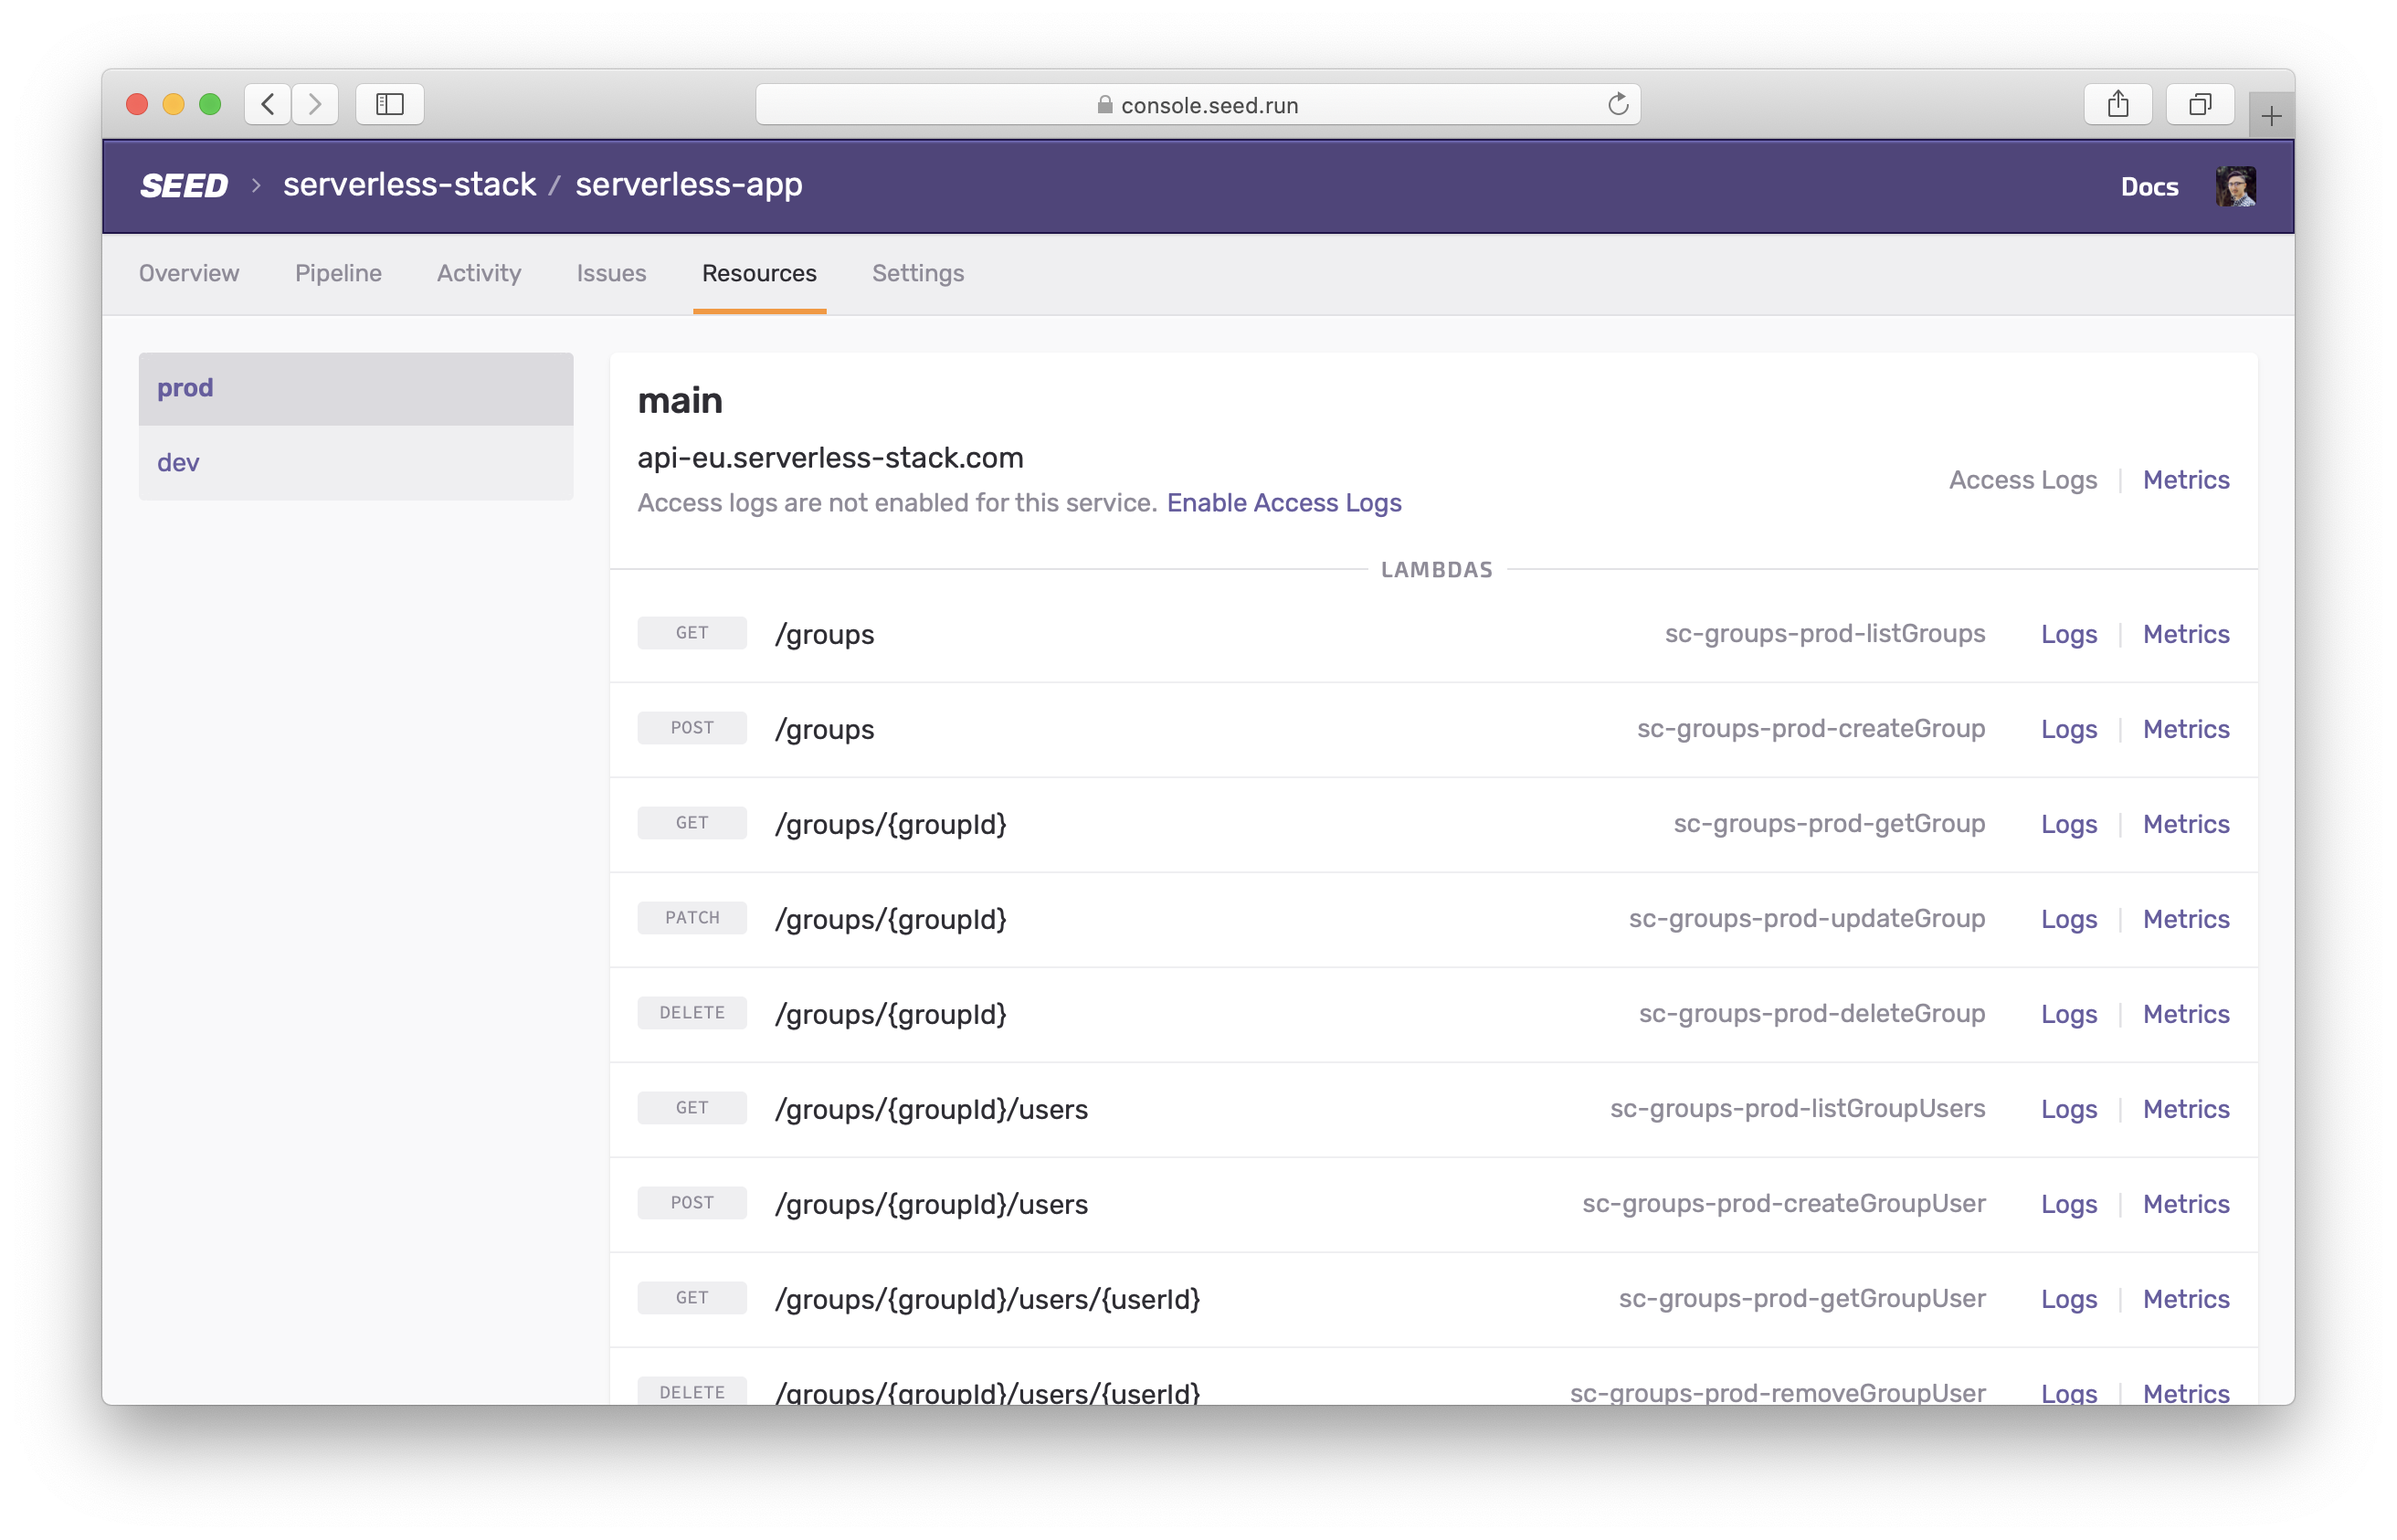
To view the Lambda logs for a stage, simply select the stage from the Resources tab.
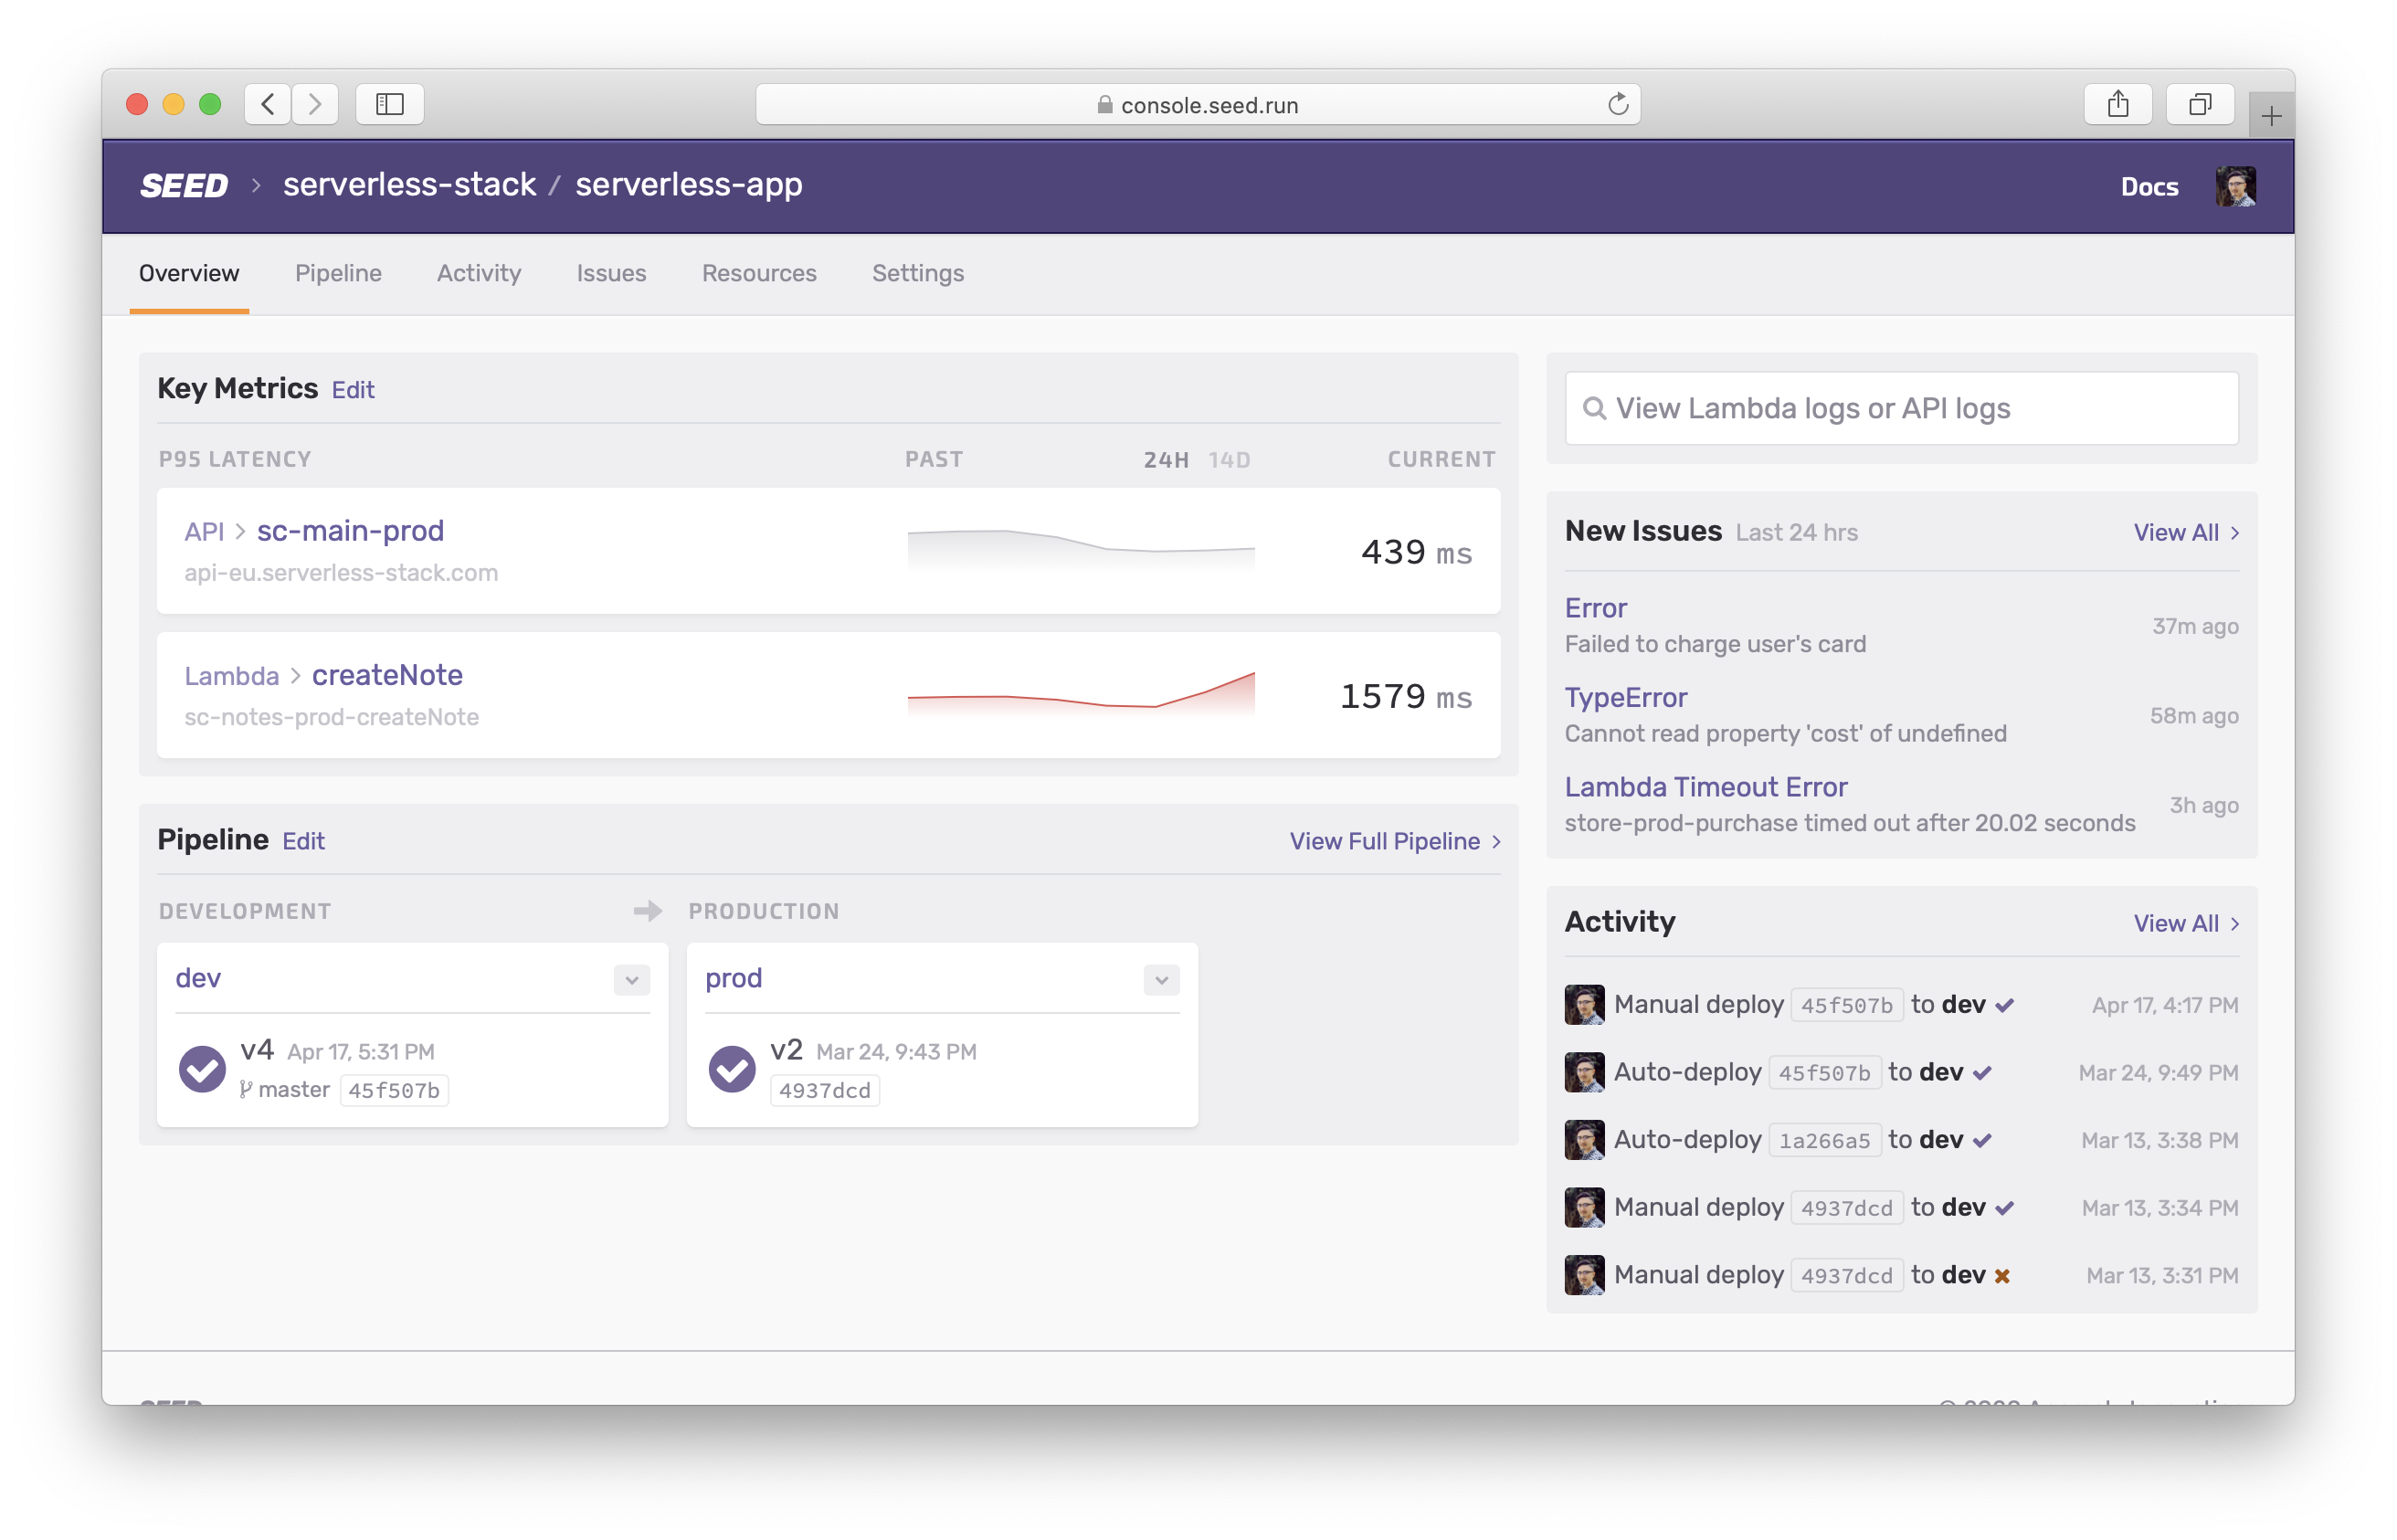
Click View Resources for the service you are looking for and navigate to the Logs for the Lambda function.
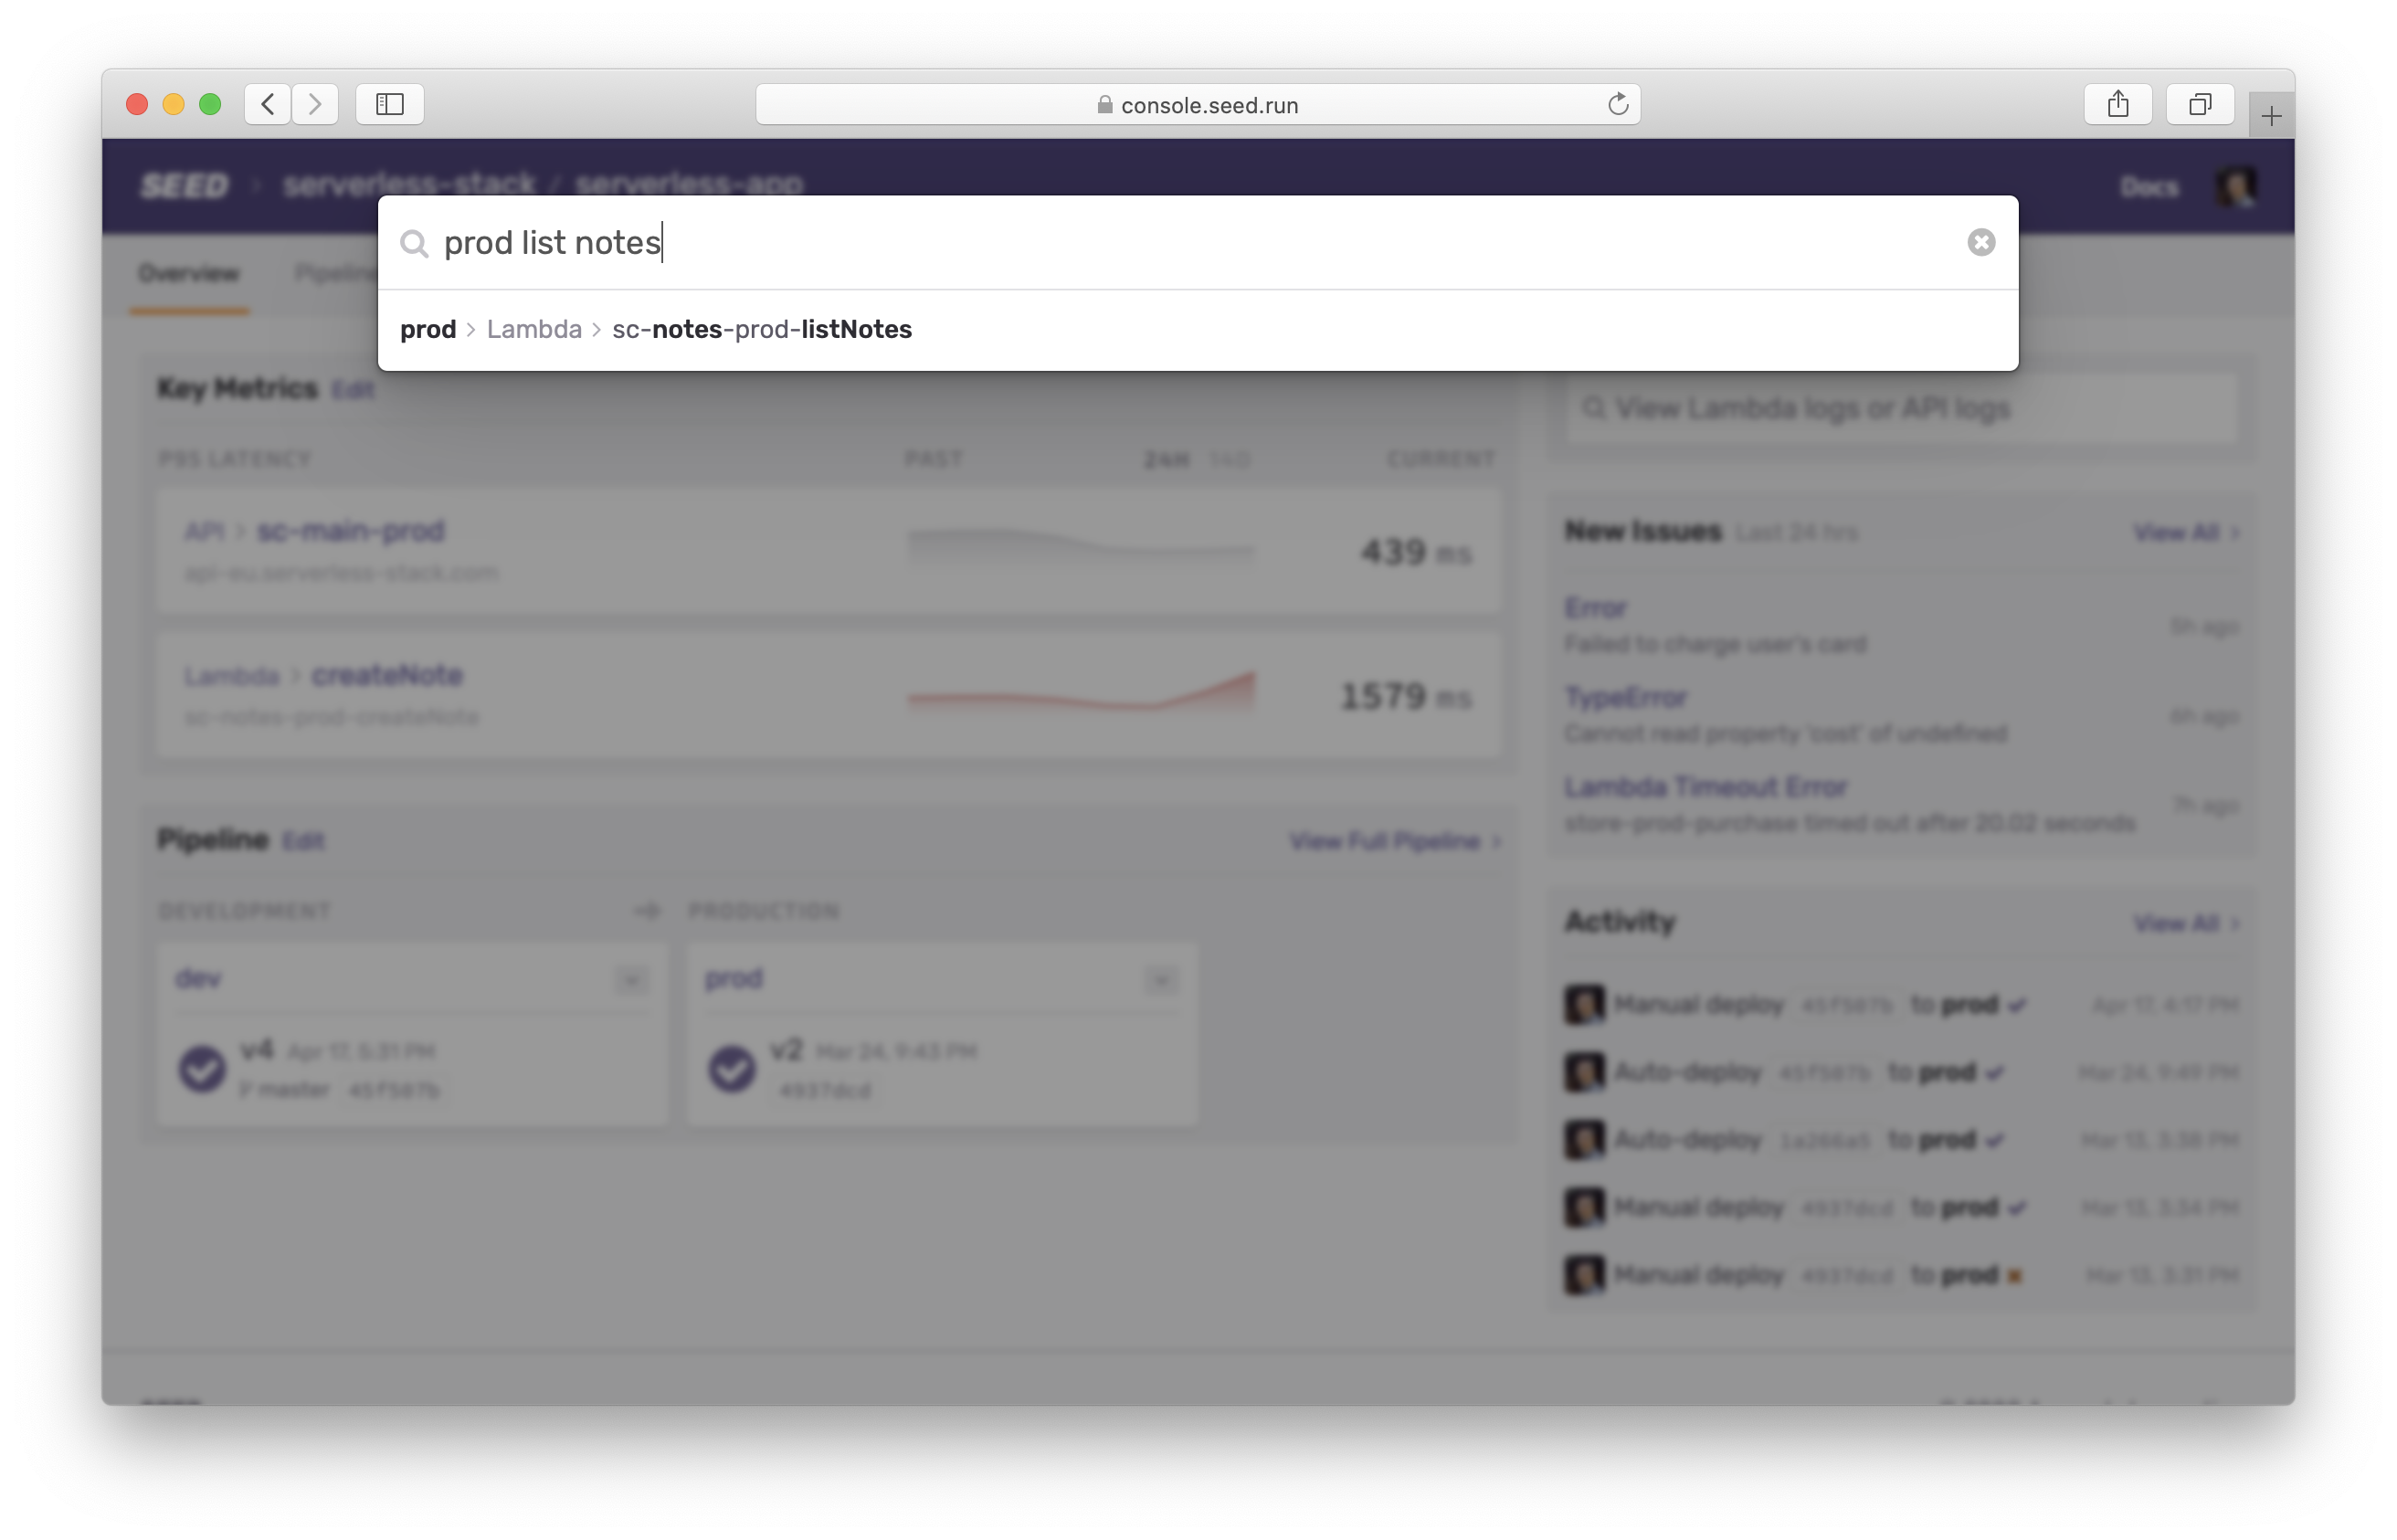
Or search for the Lambda function right from the dashboard.
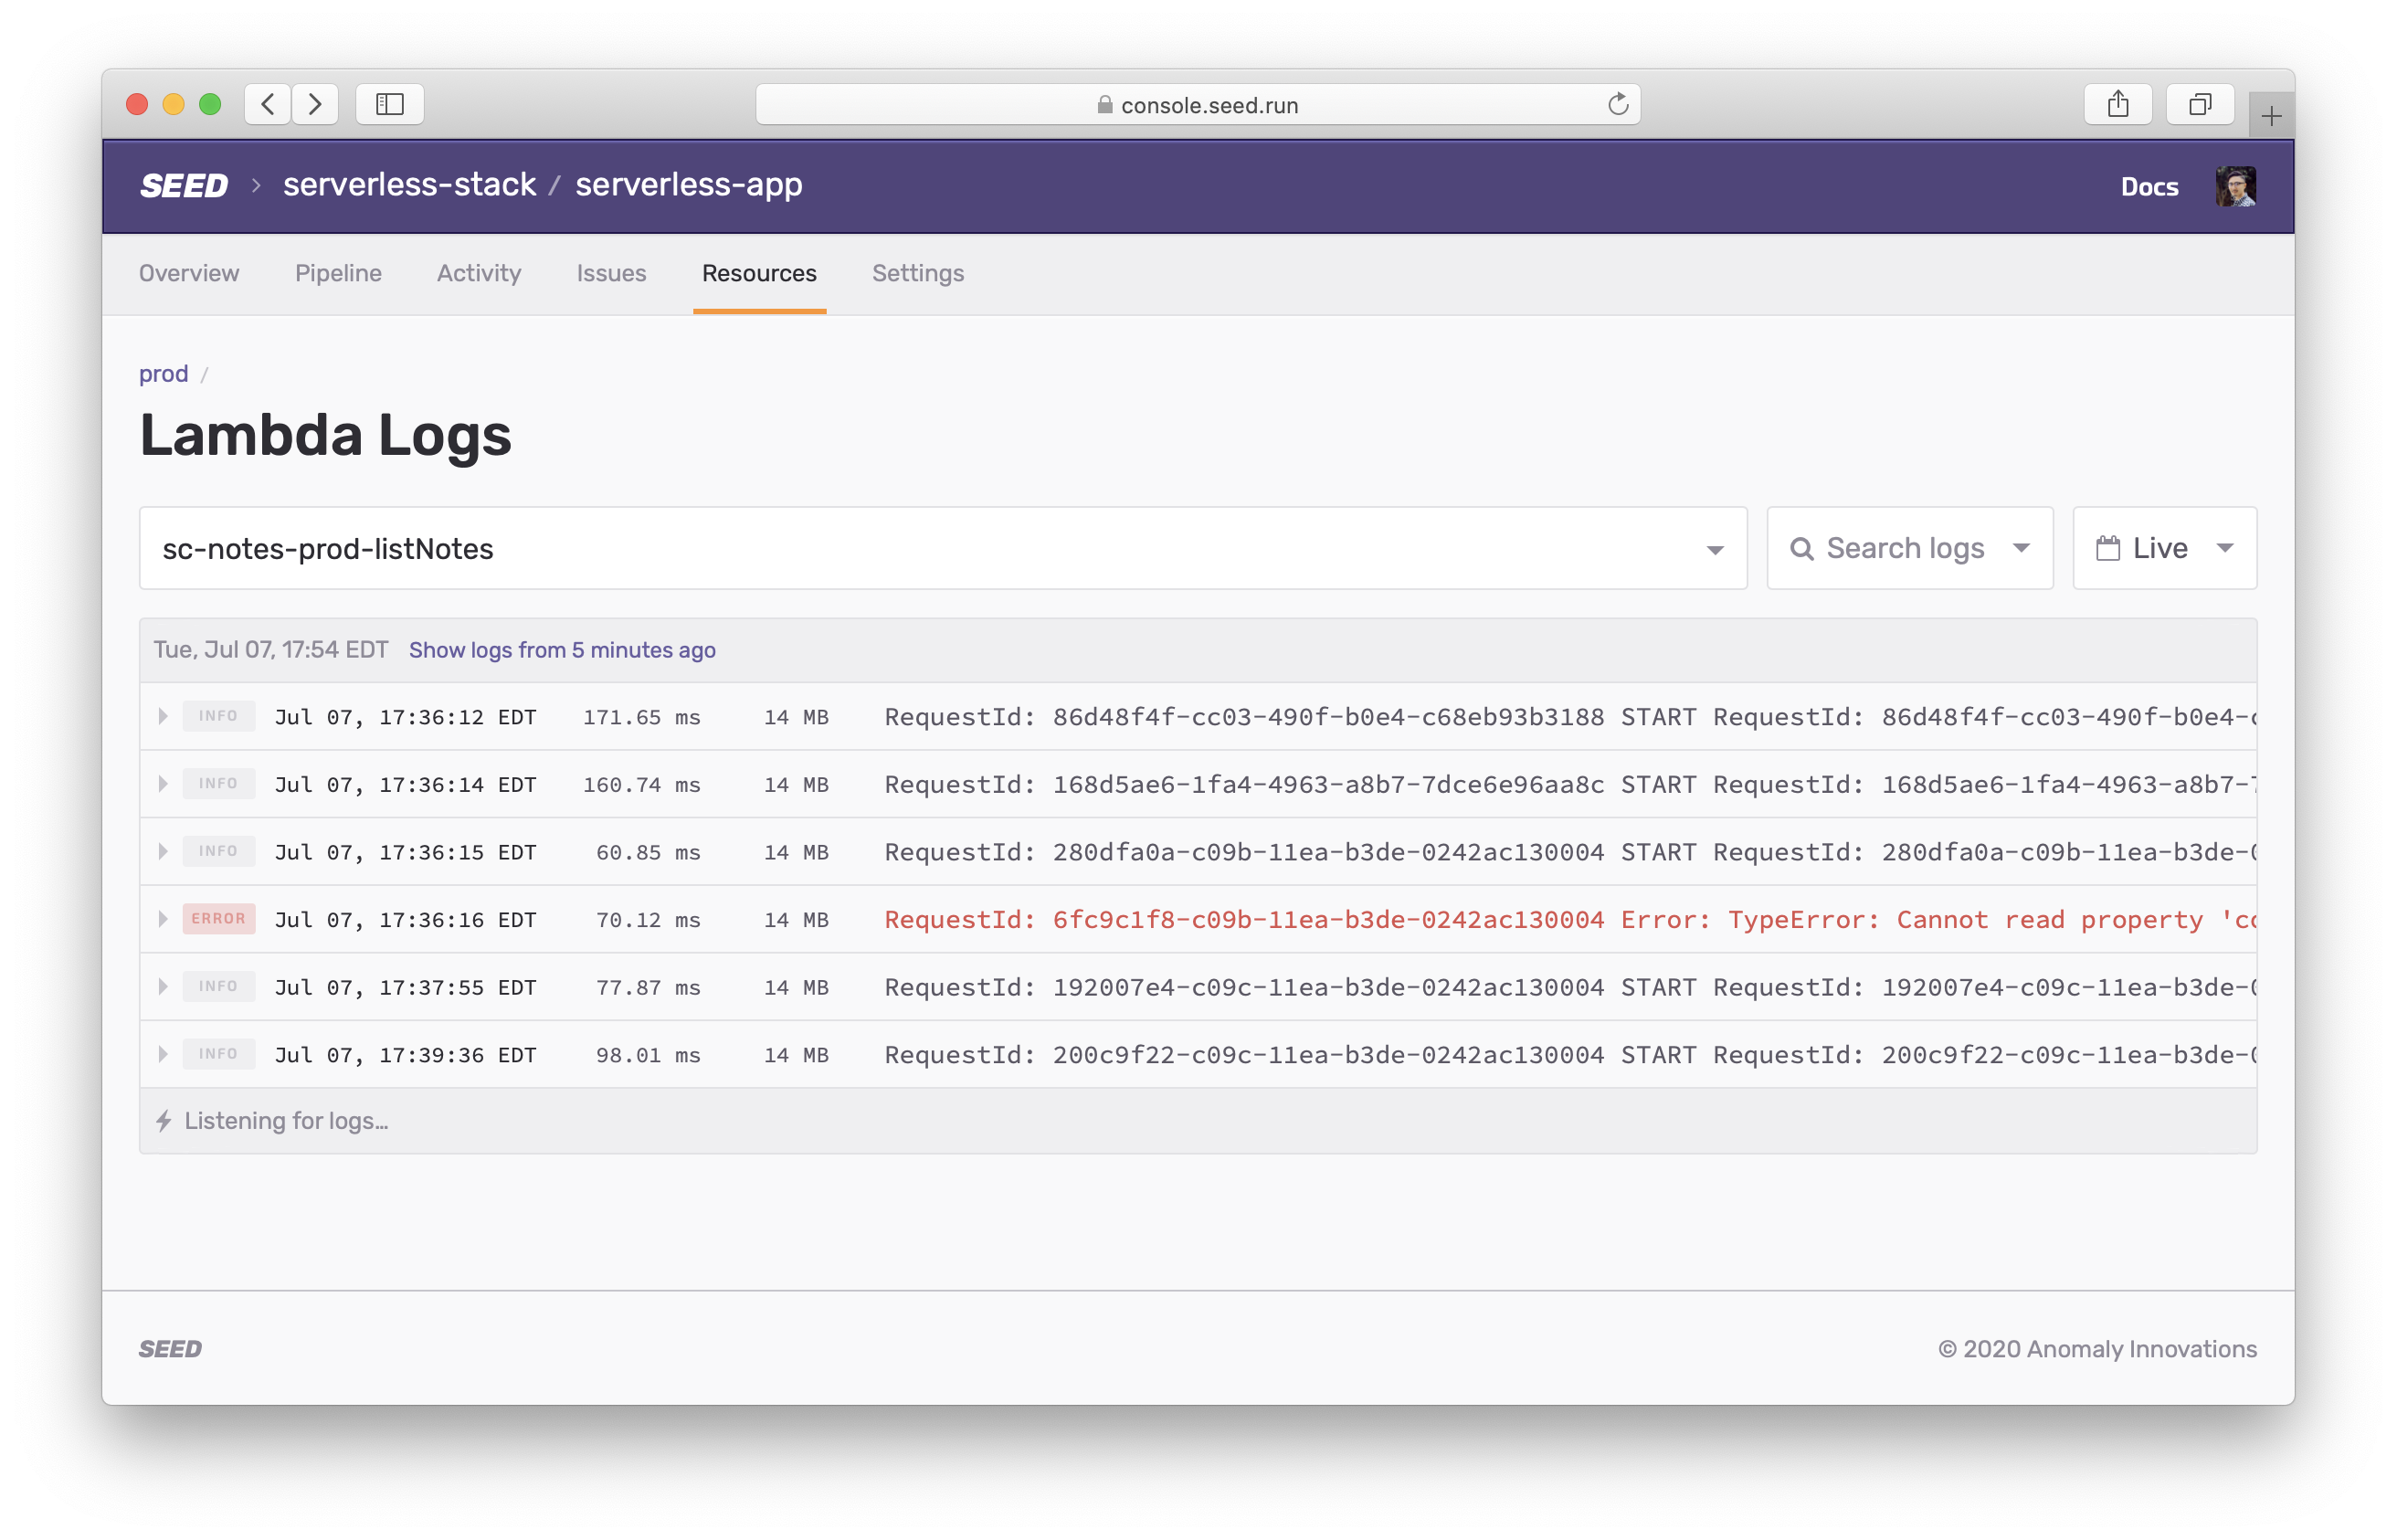
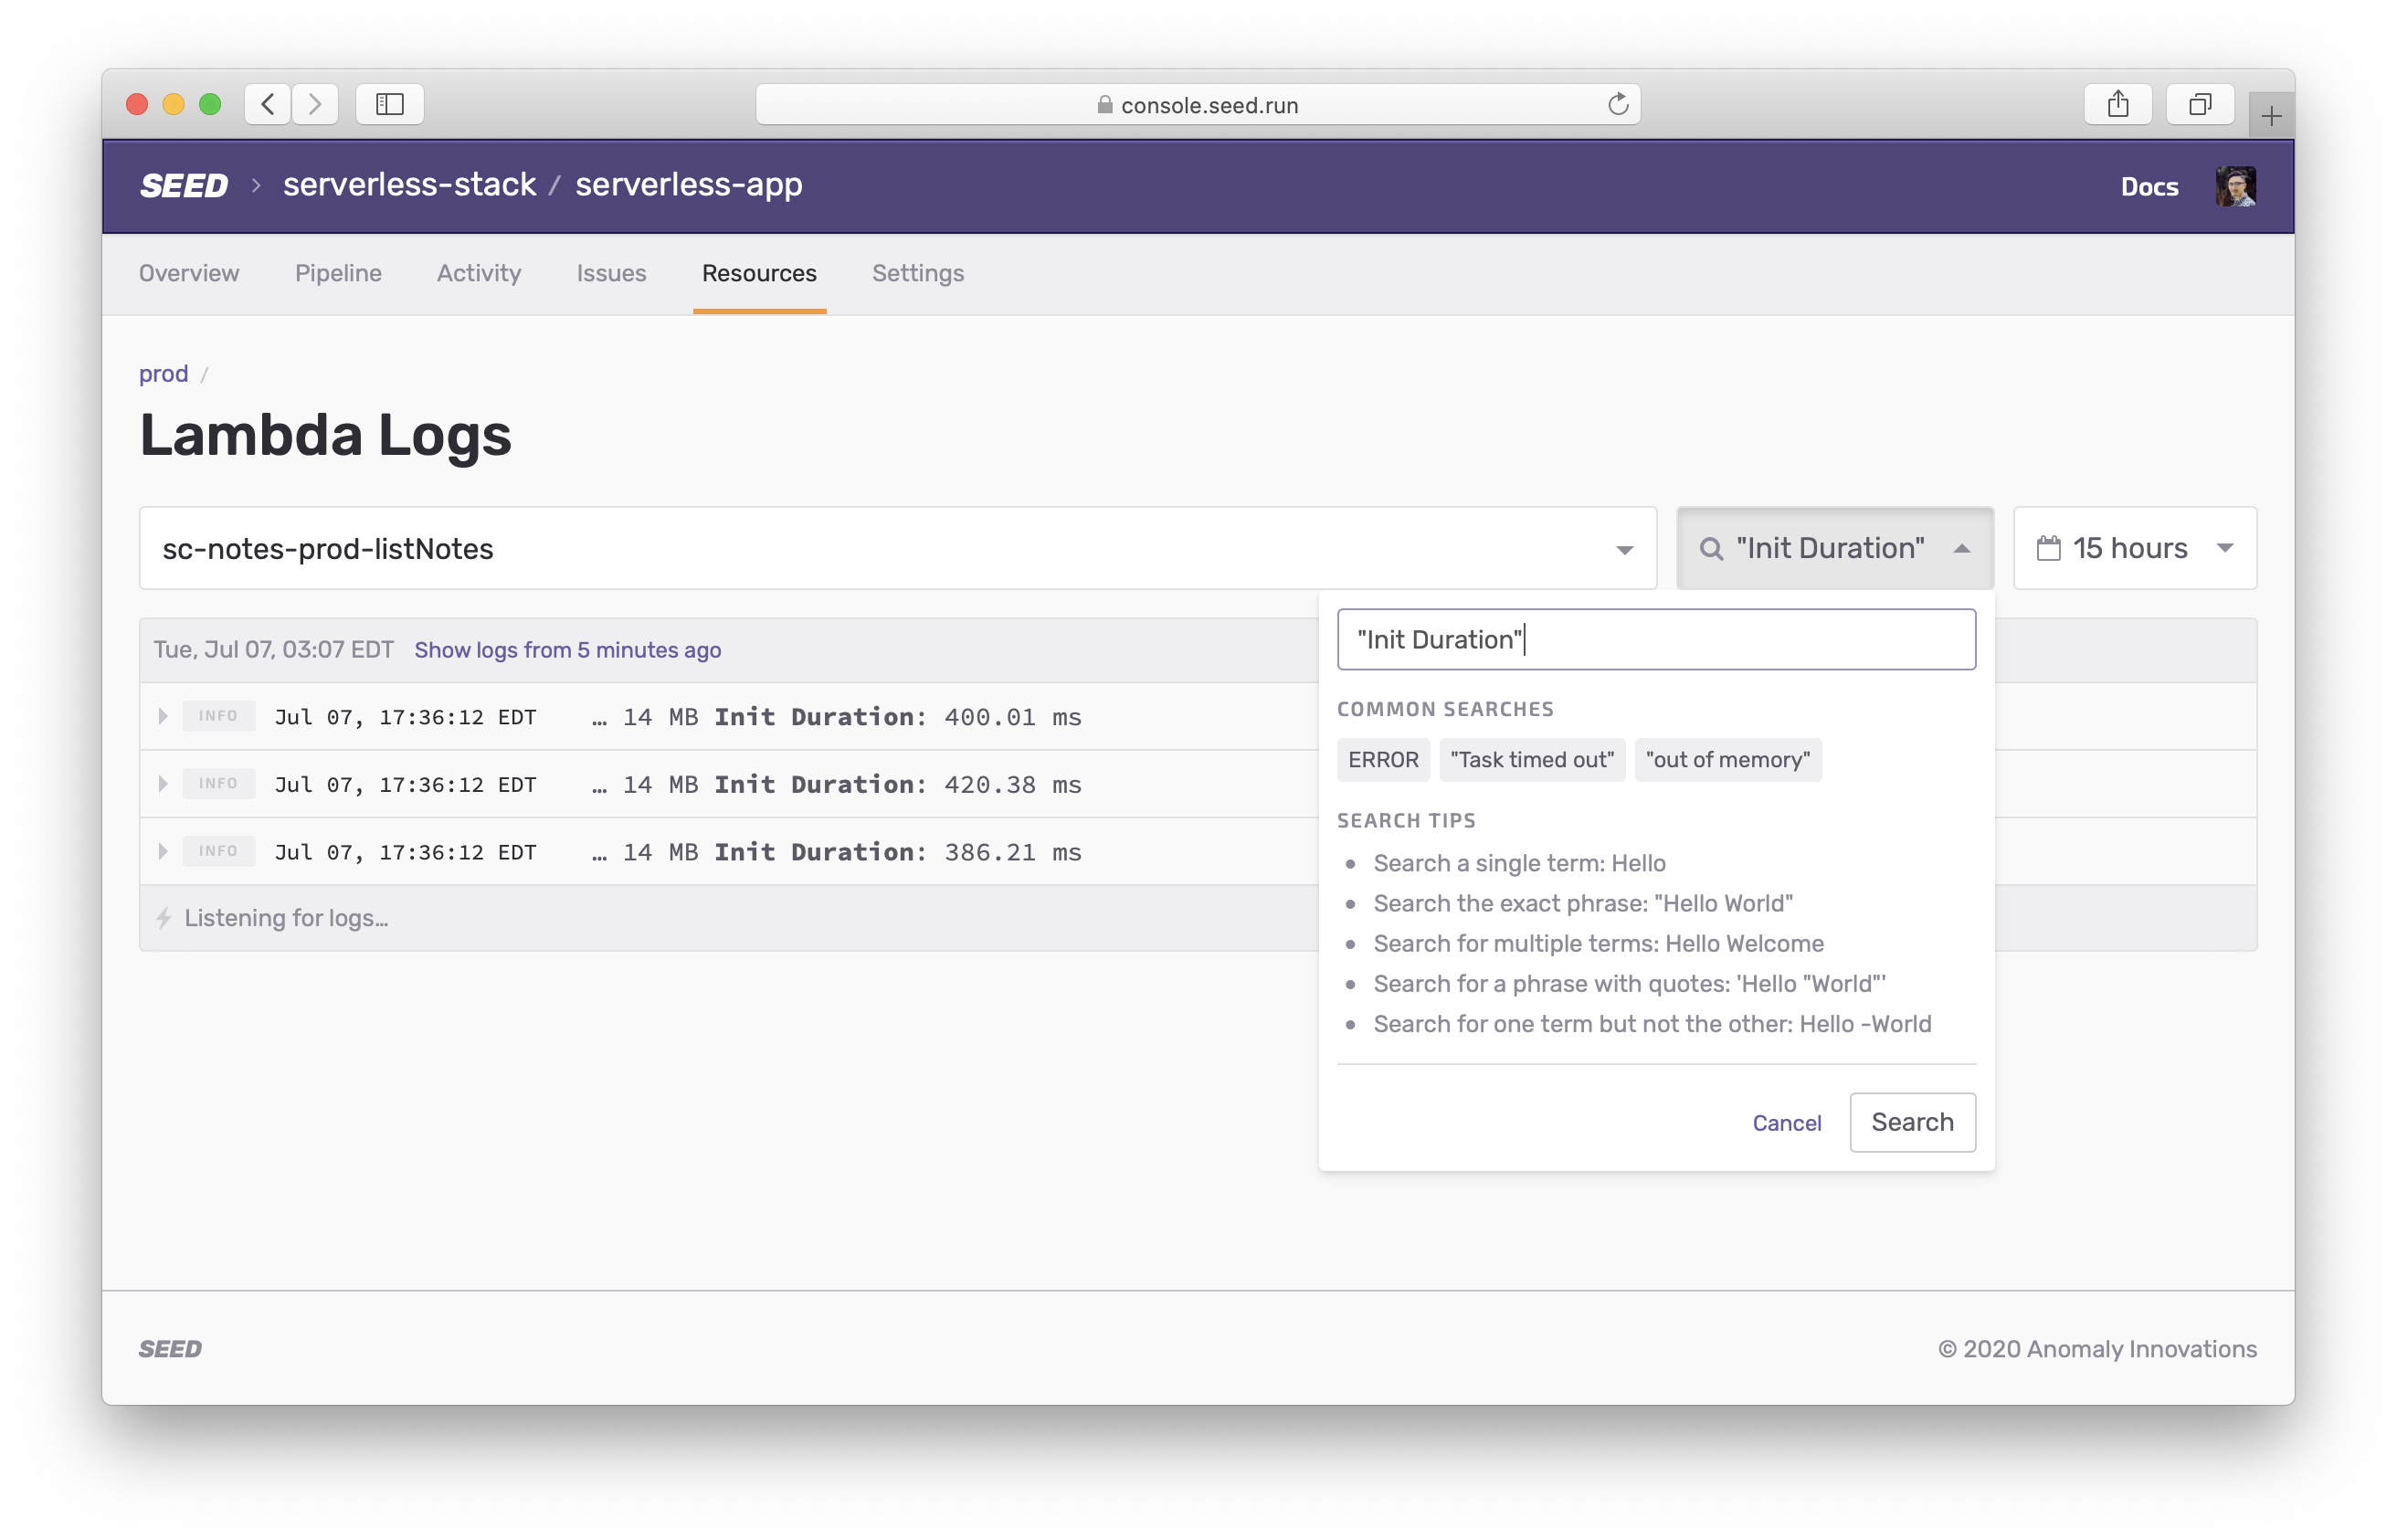
This gives you a Live look at the logs for this Lambda function.
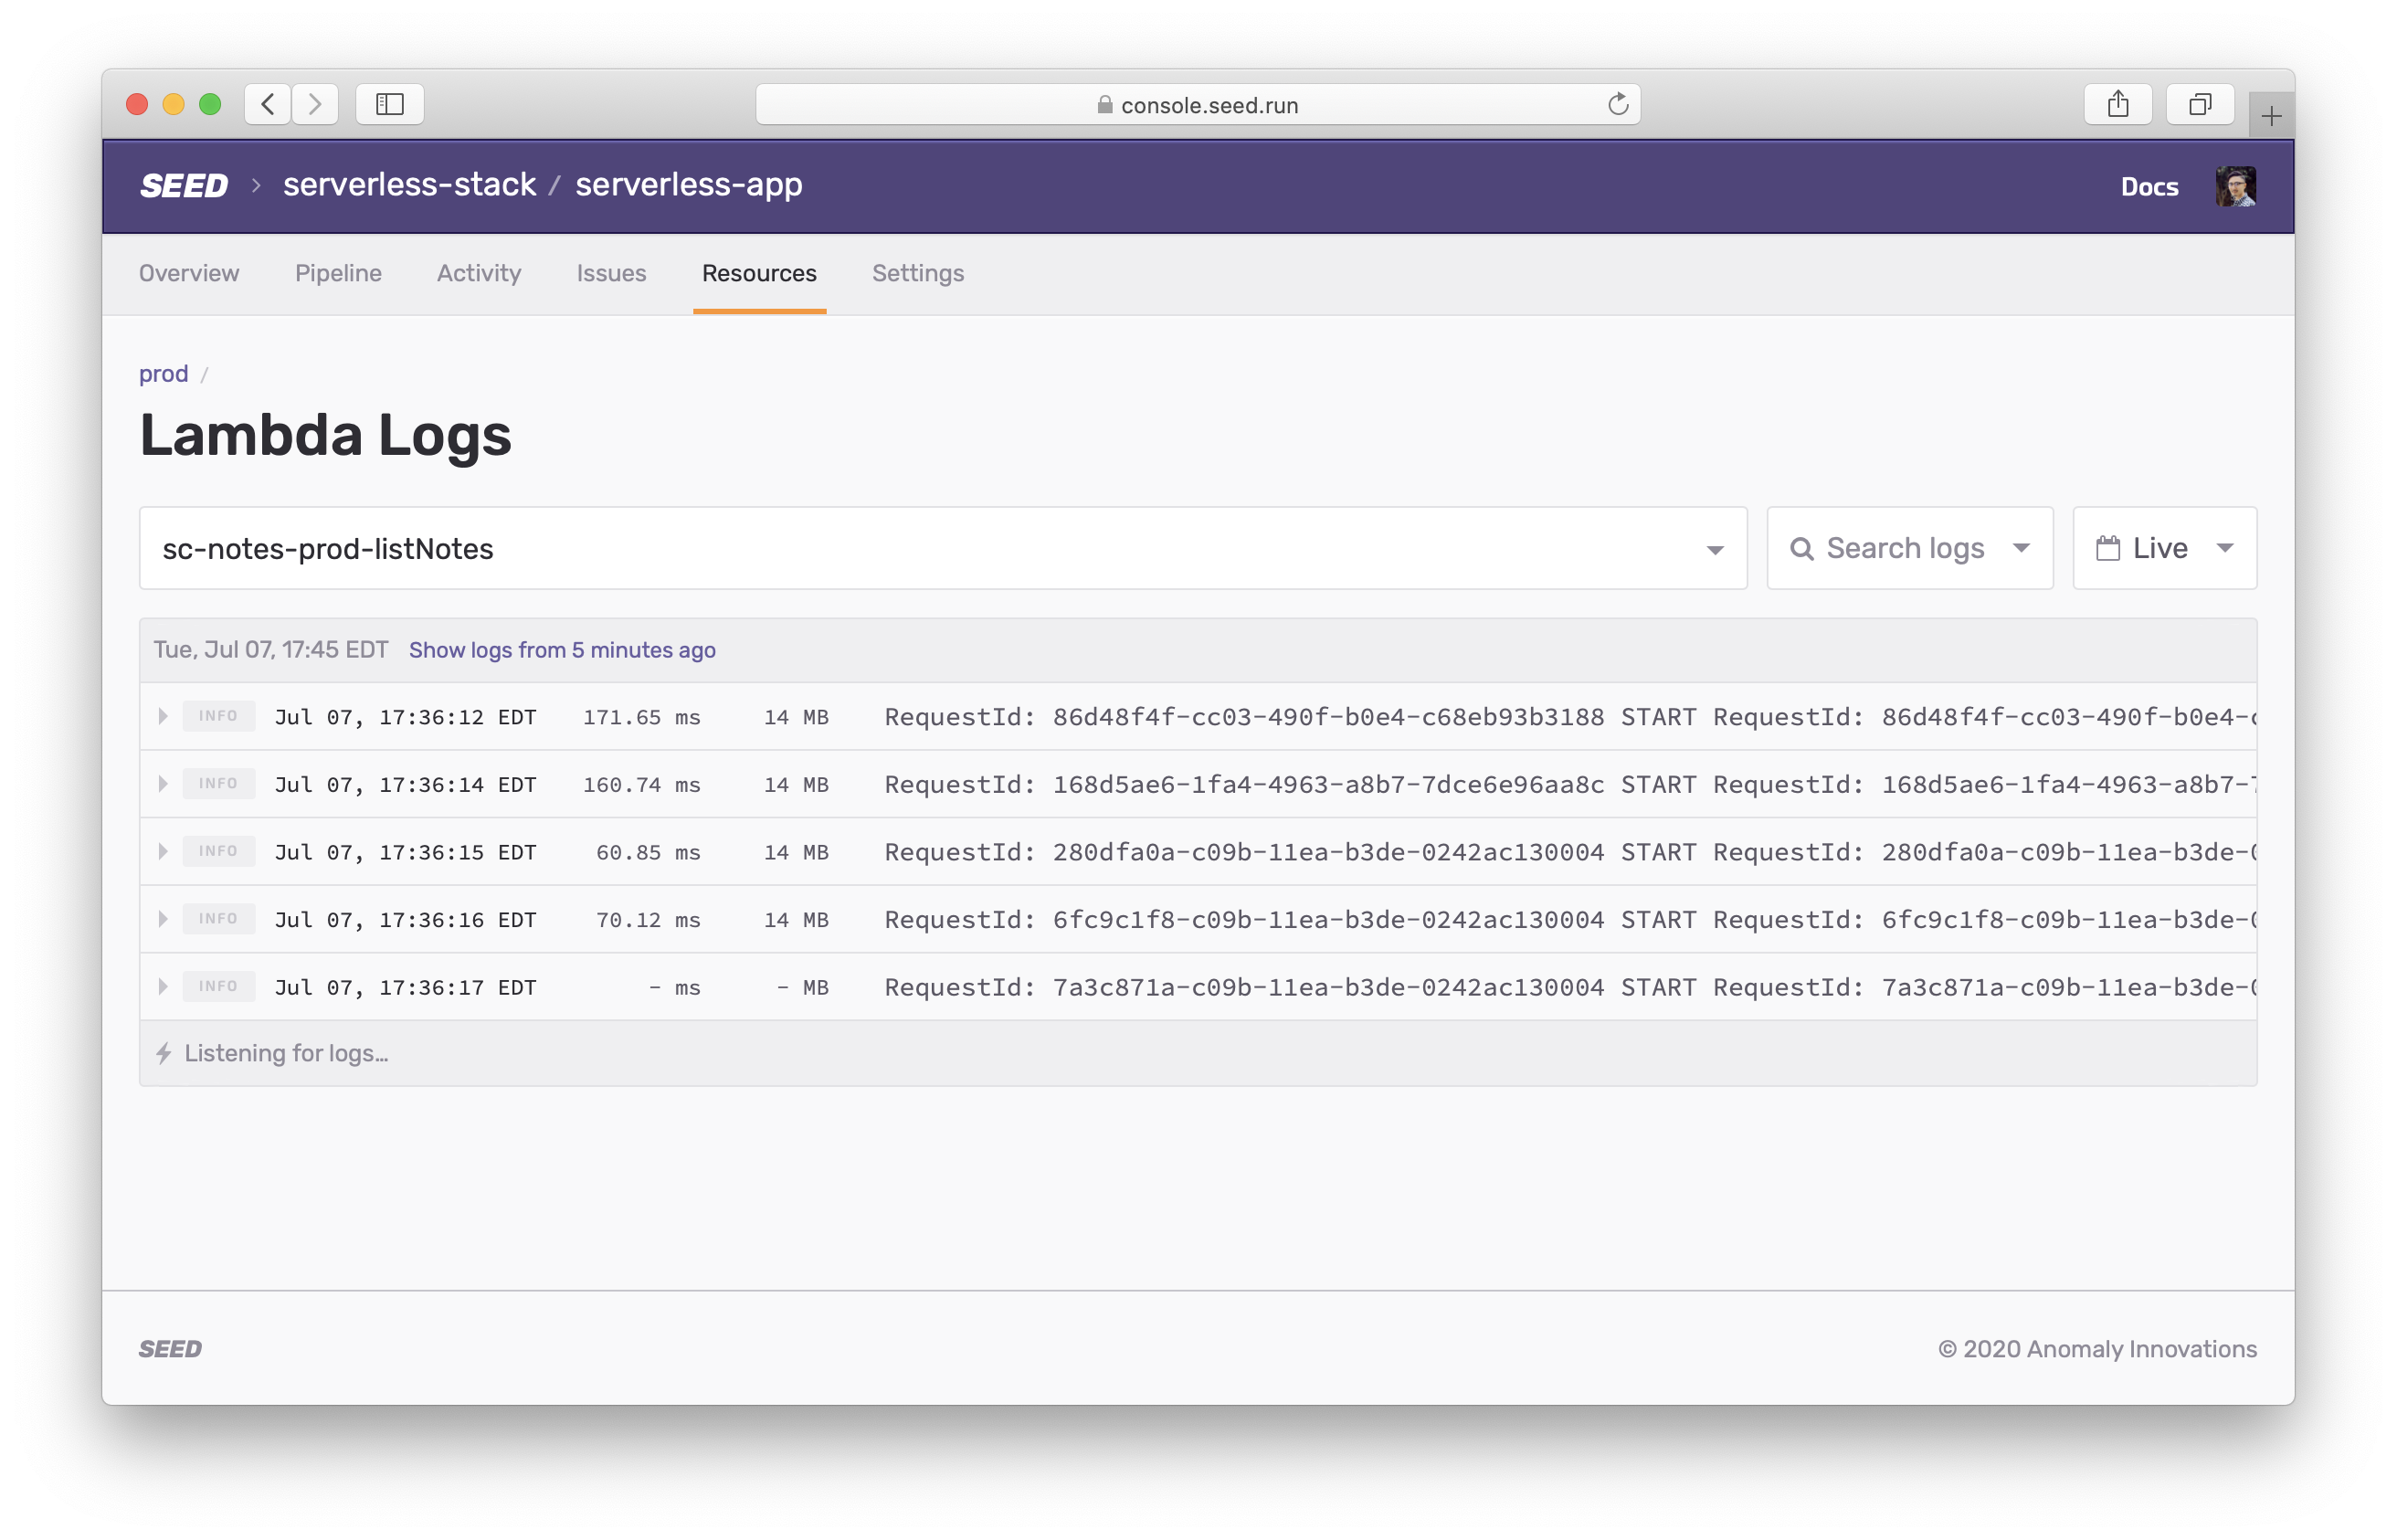
If you are viewing logs for a high traffic Lambda, note that some logs might be skipped since the viewer might not be able to keep up with all the logs.
Logs with errors are highlighted. In Node.js 10 and 12, console.error and console.warn are highlighted as errors or warnings respectively.
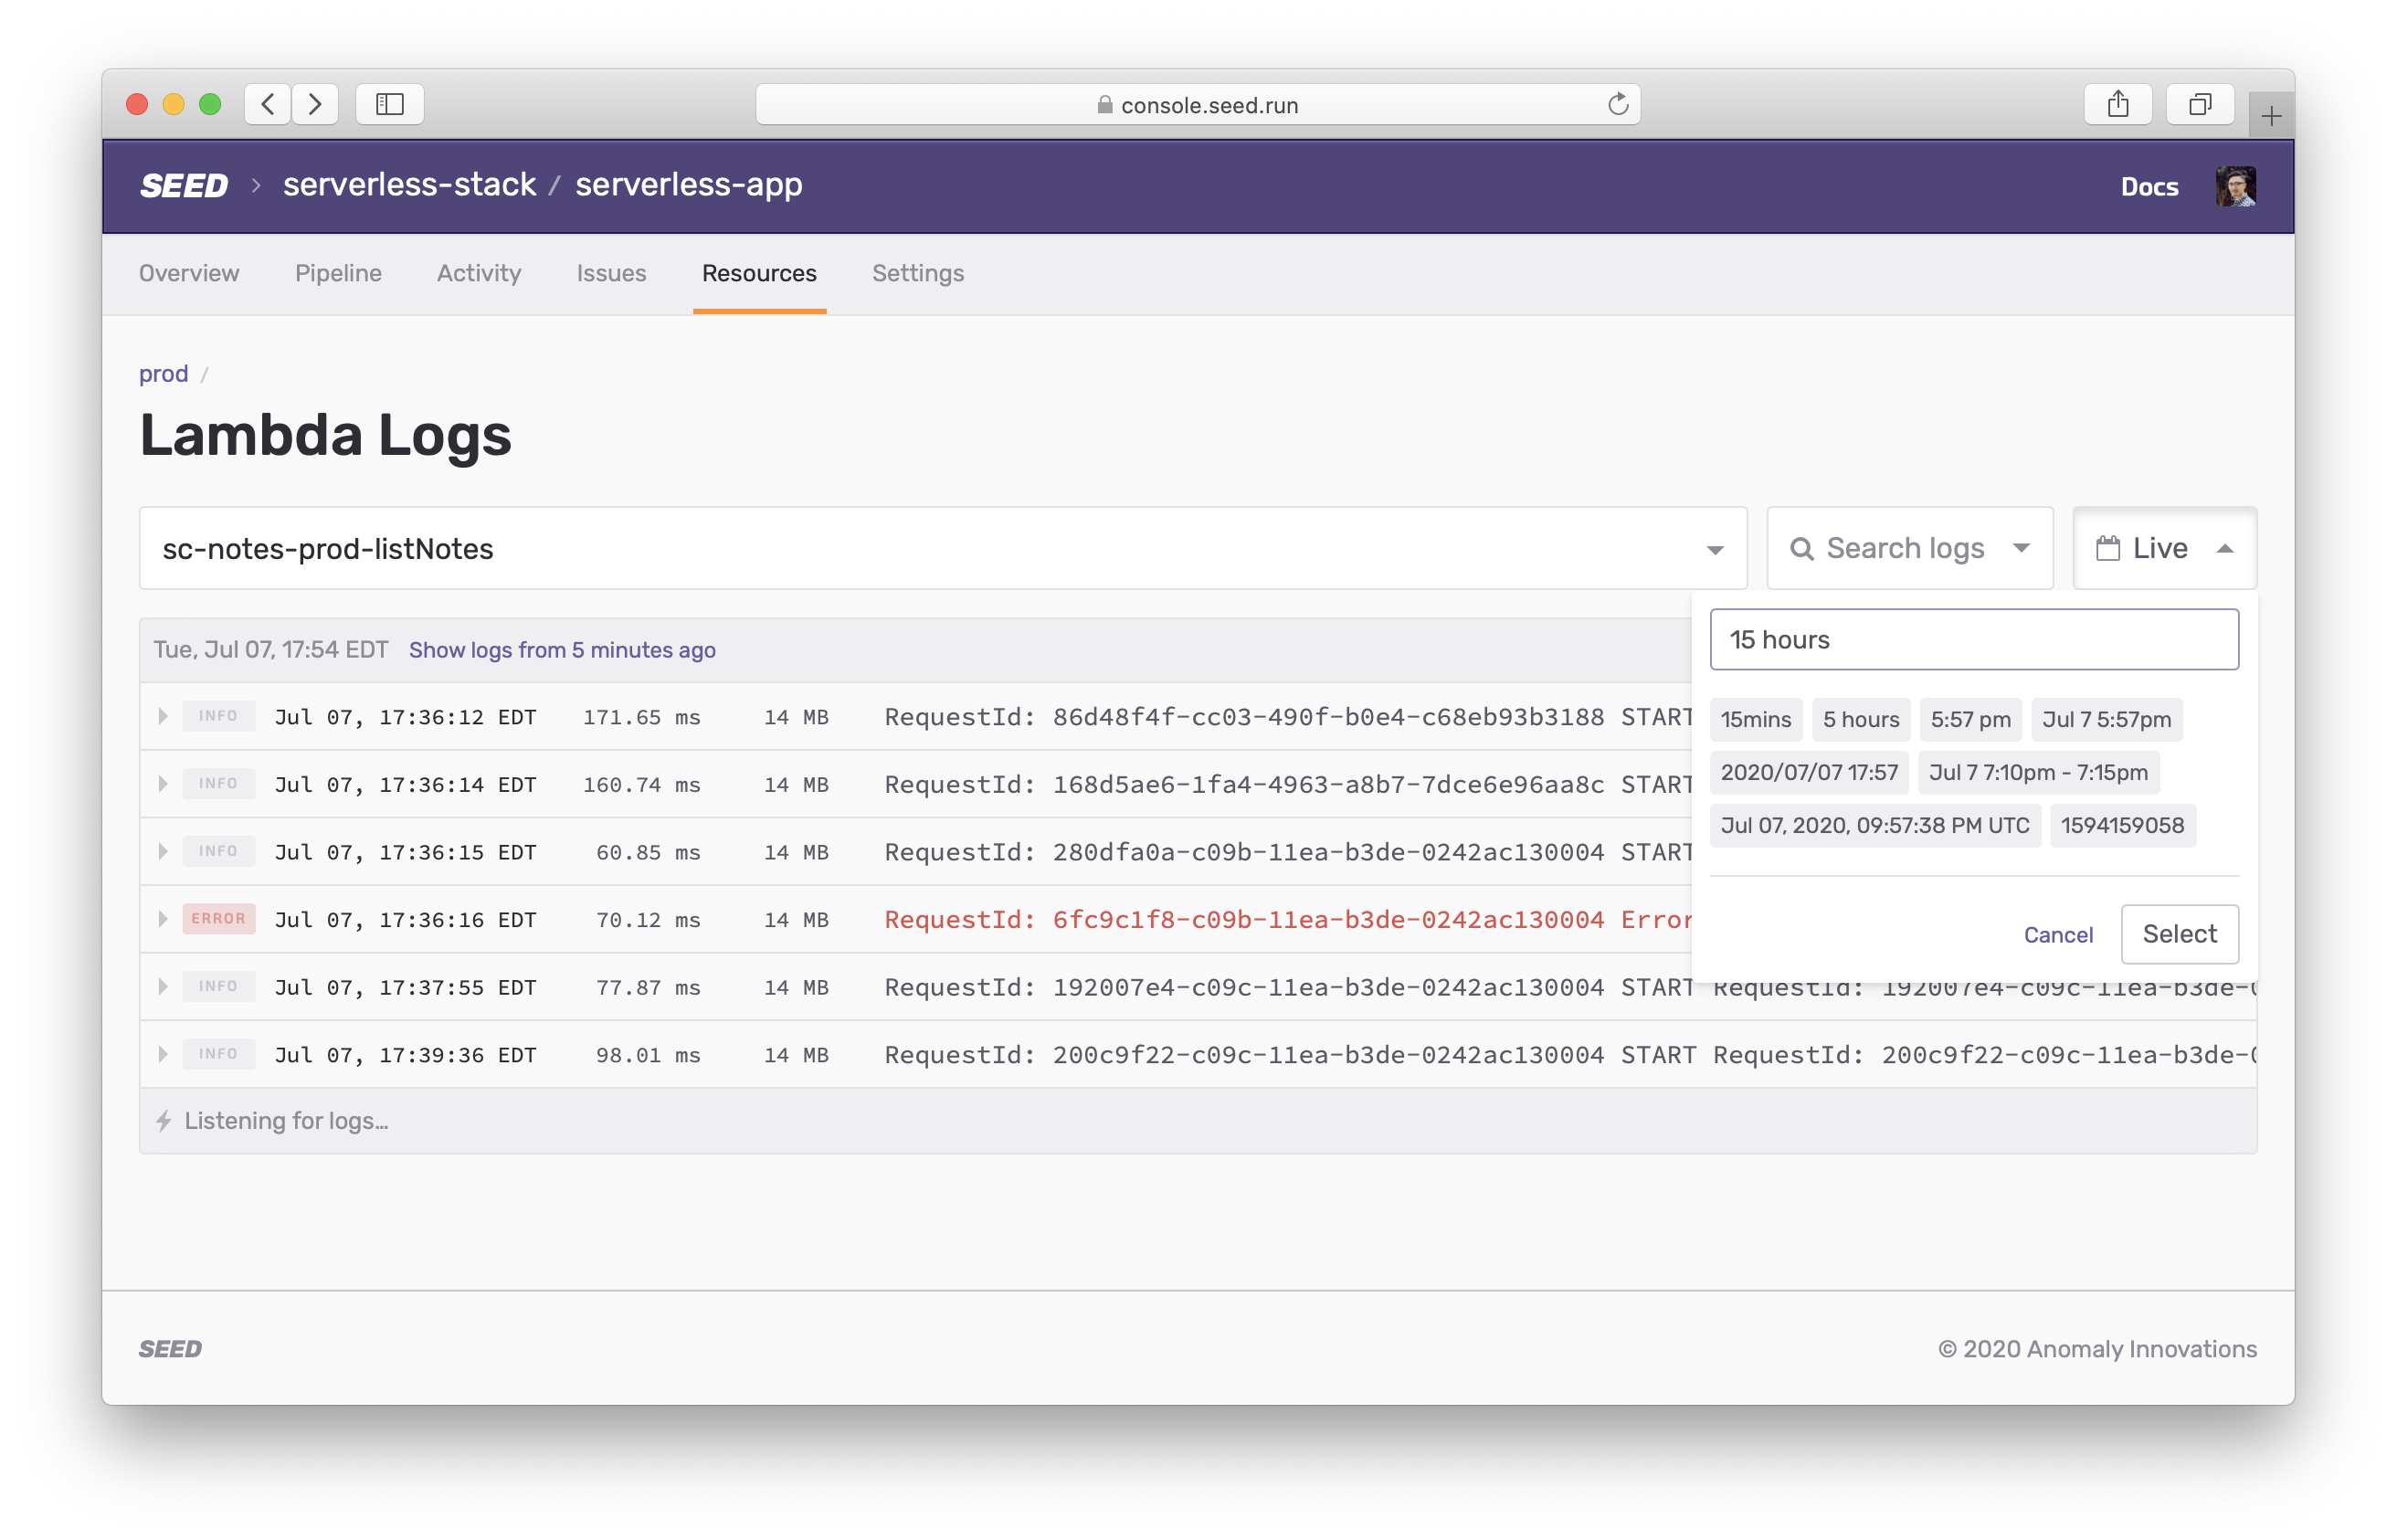
You can also filter the logs by time. Or enter a specific time or range to query the logs.
Seed by default groups all the logs for a single Lambda request together.
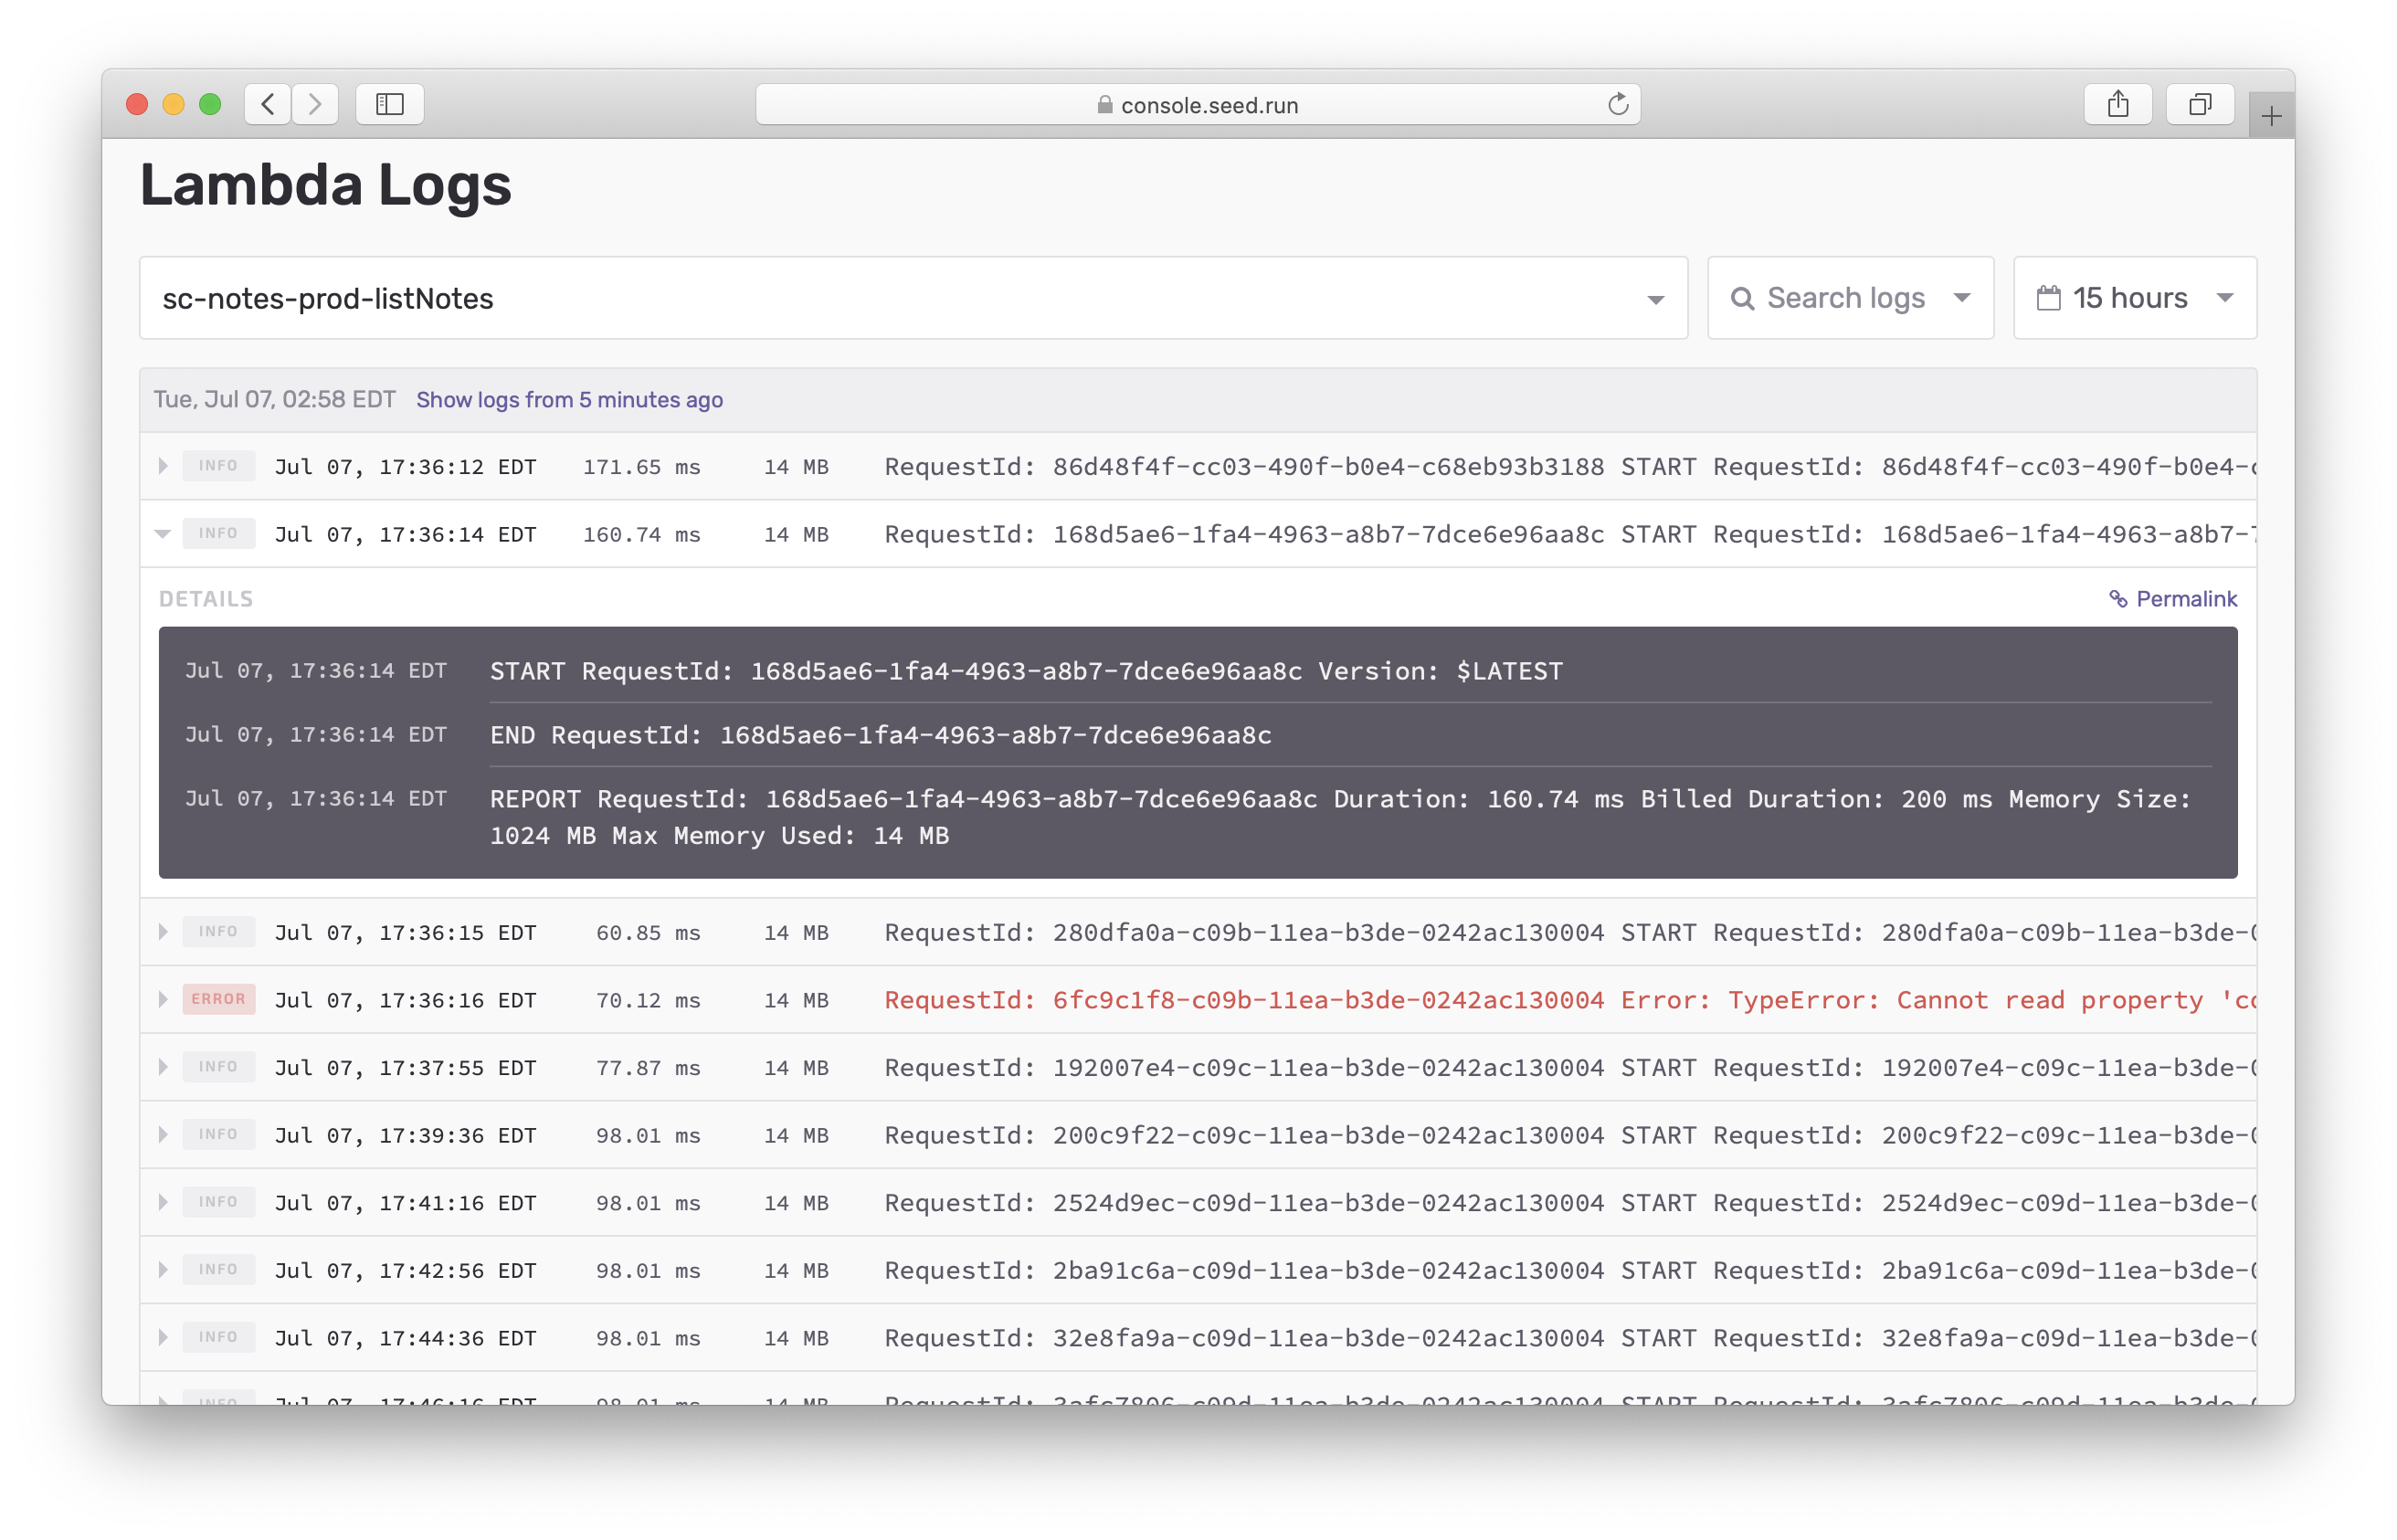
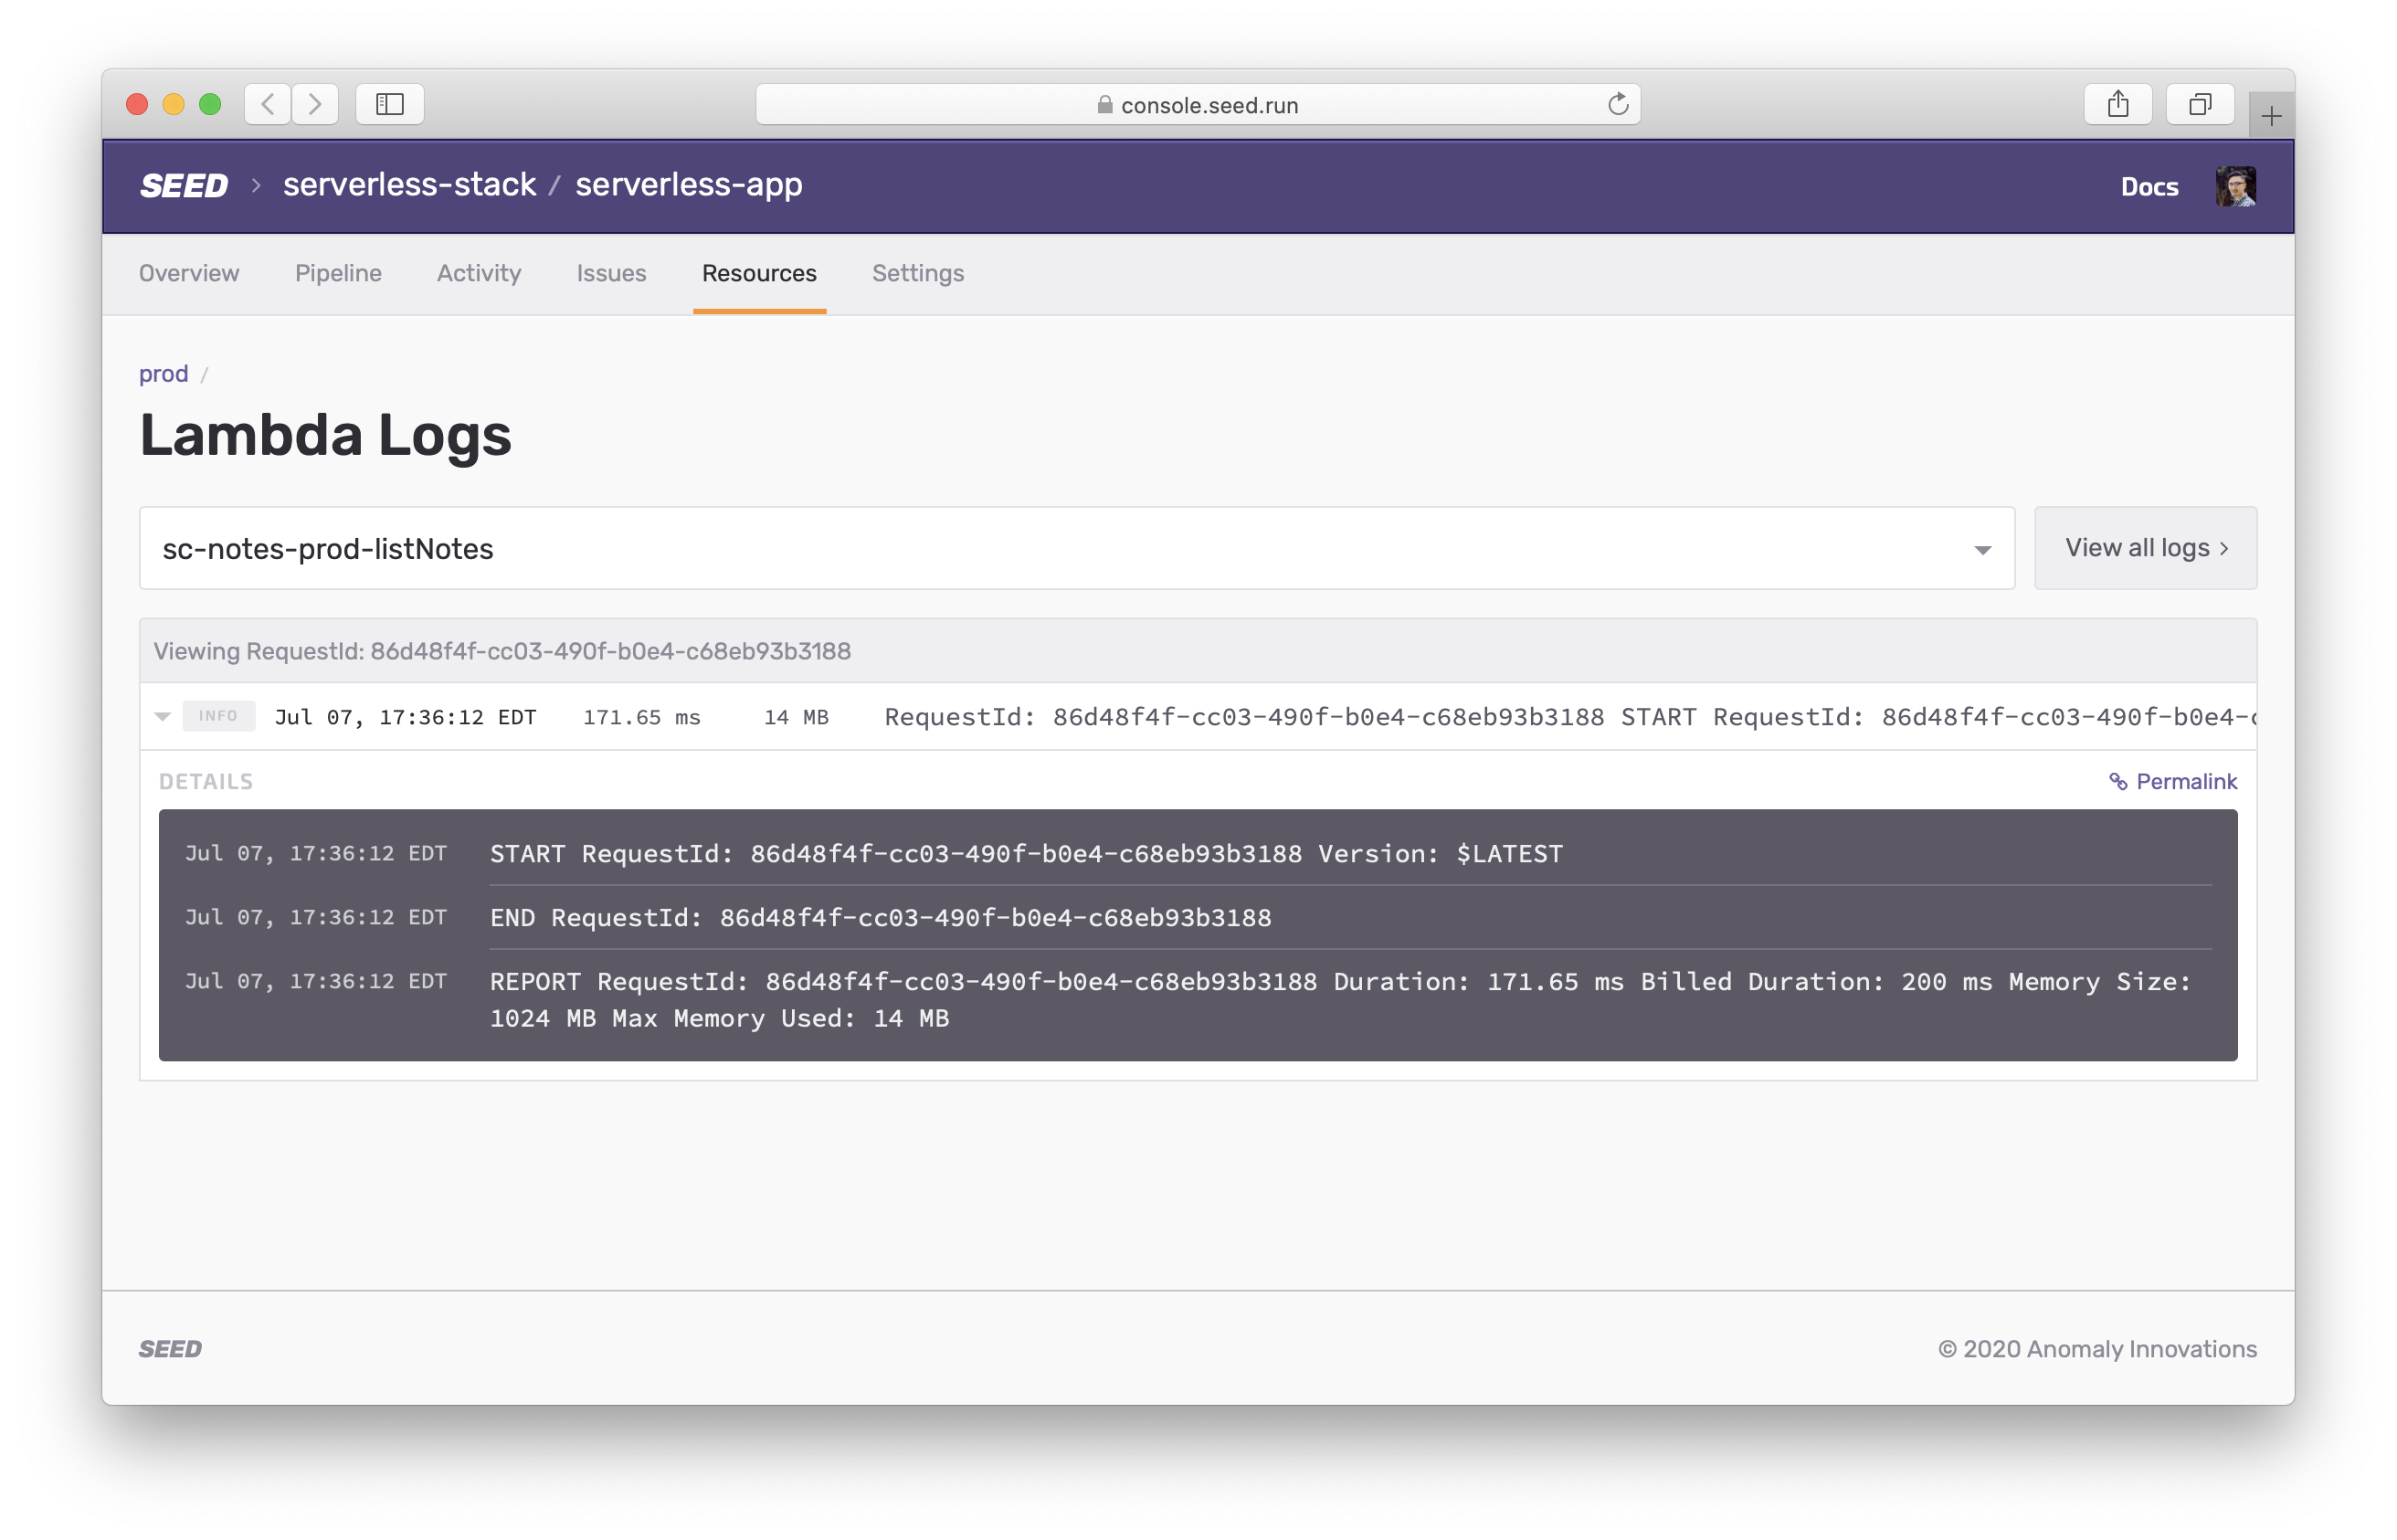
Each request gets its own Permalink that you can share with your team.
Logs can also be filtered by terms.
Access Logs
If you have an API Gateway endpoint in your deployment, you can view the access logs for this as well.
API Gateway Access Logs are disabled by default and need to be enabled on AWS. You’d need to create an IAM Role, configure CloudWatch, etc. to do so. We simplify this on Seed.
You can enable it by hitting Enable Access Logs button.
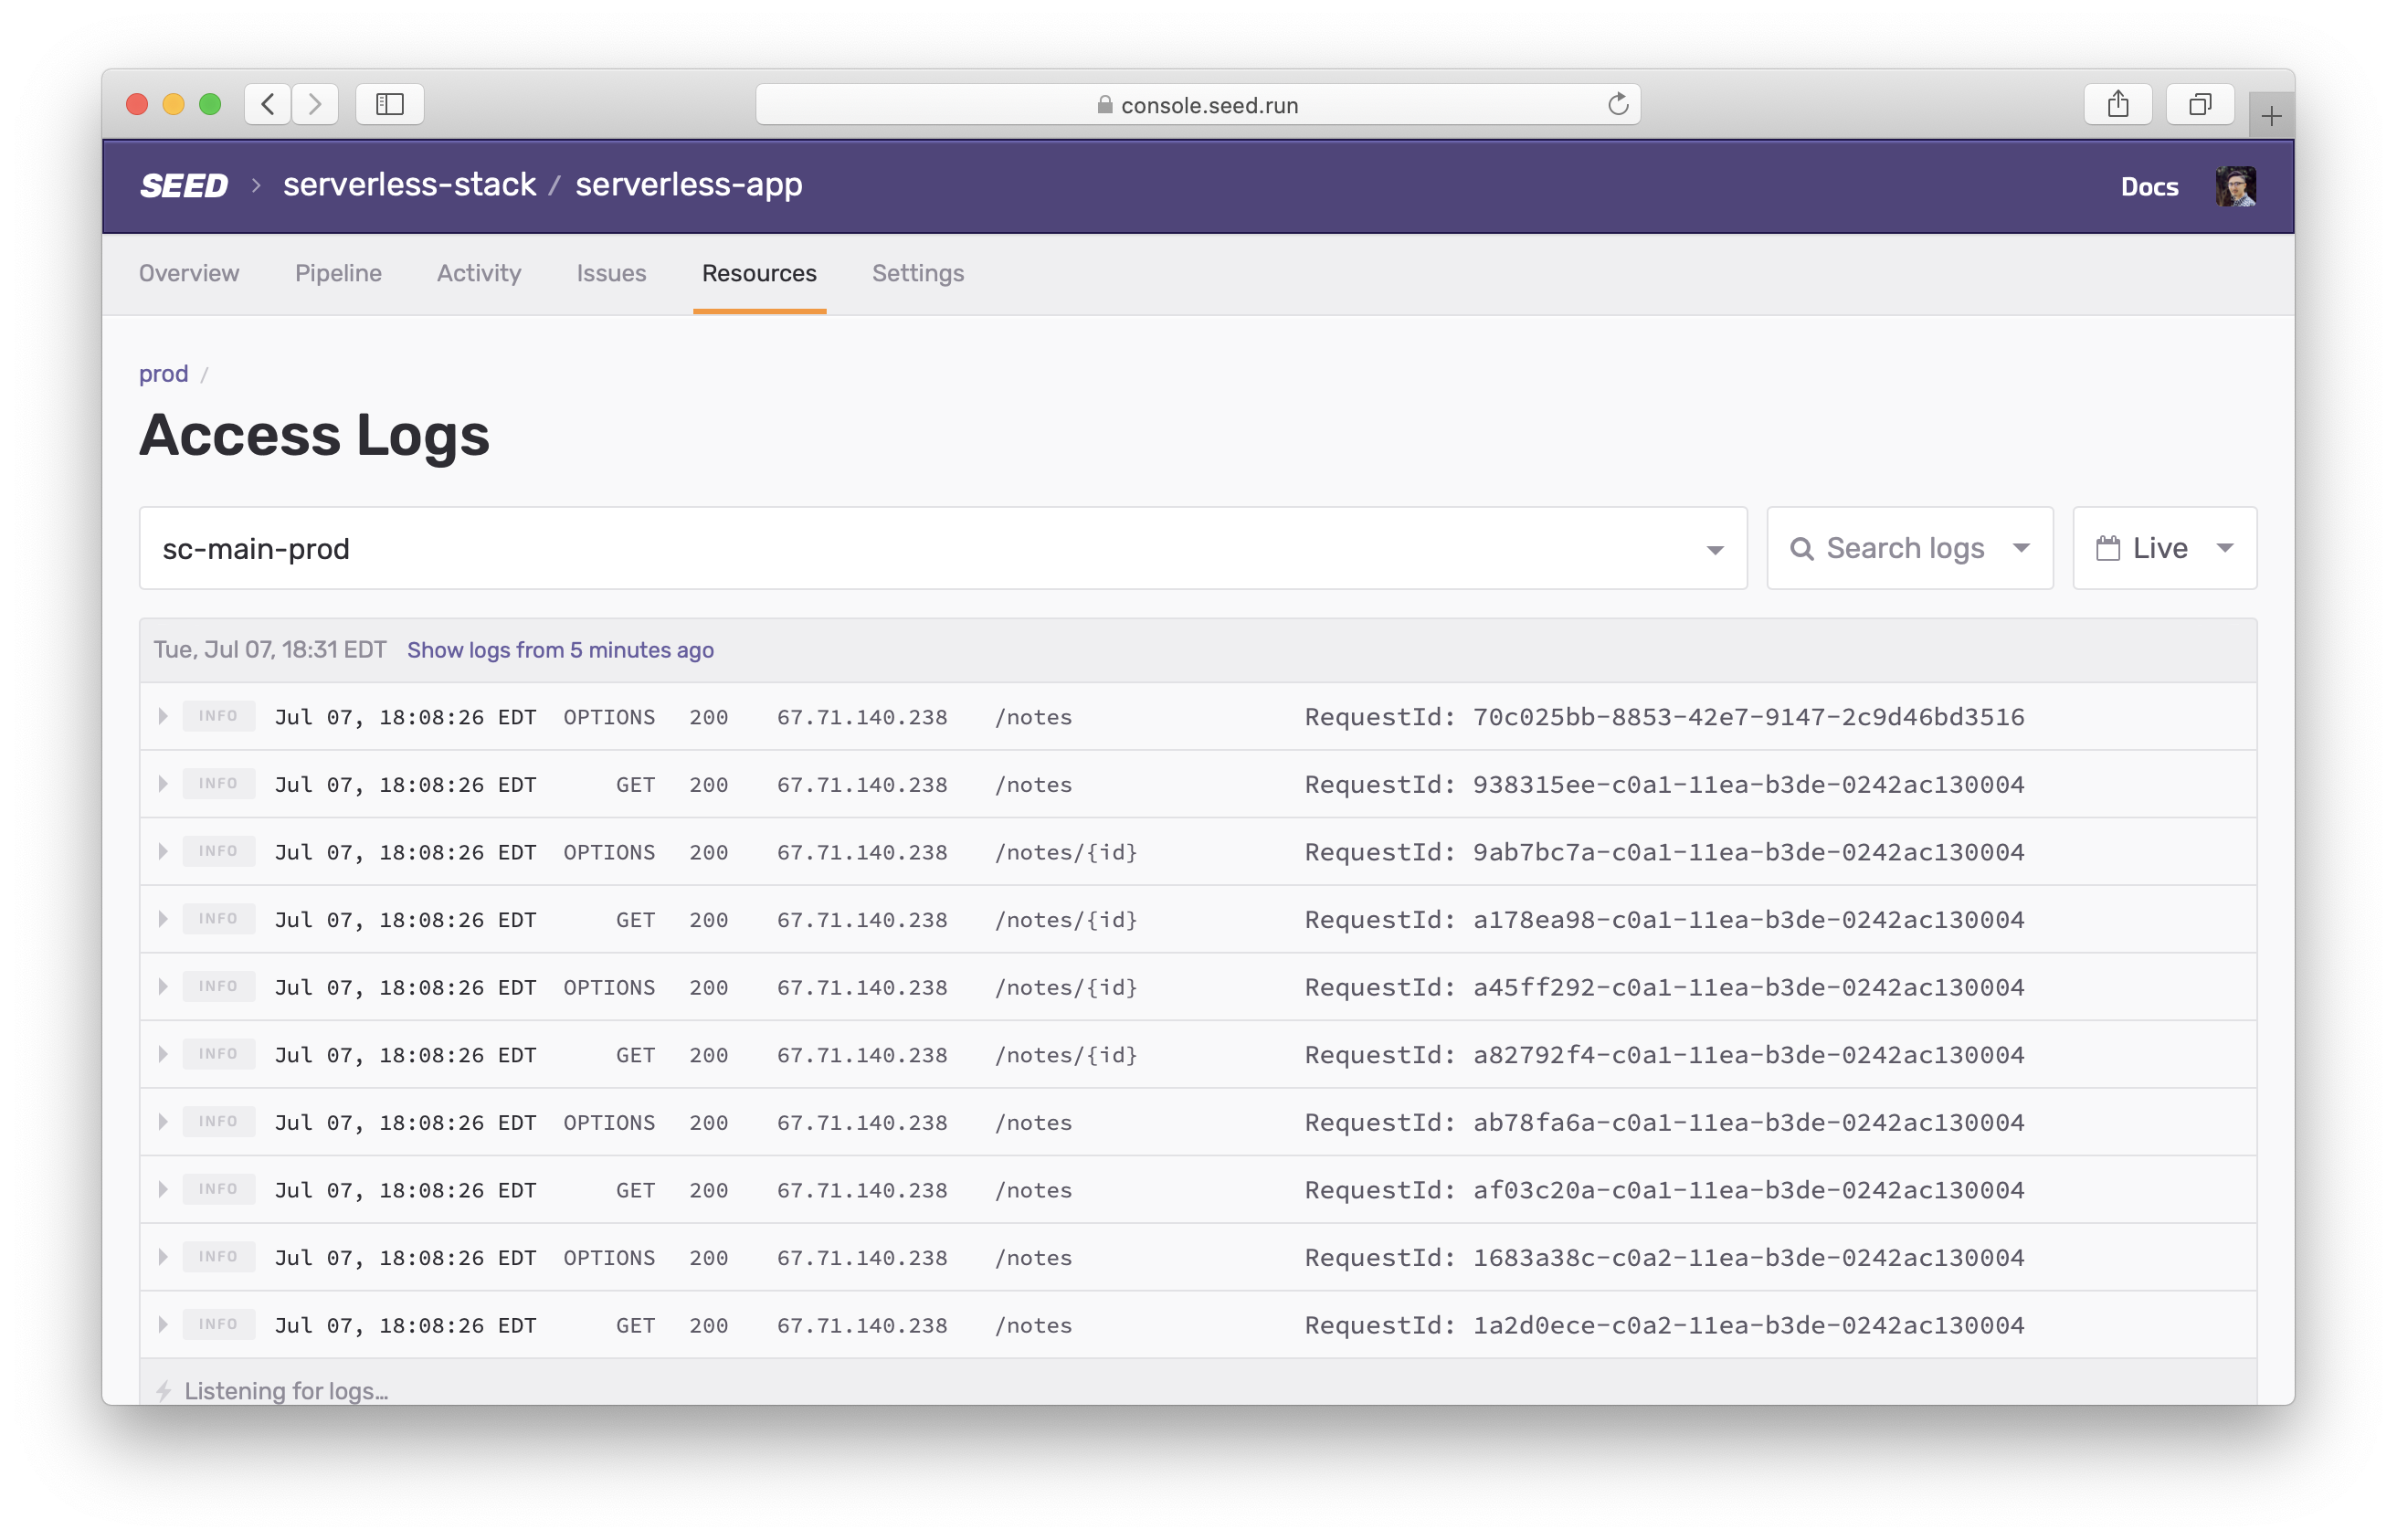
Access logs are displayed similar to the Lambda logs.
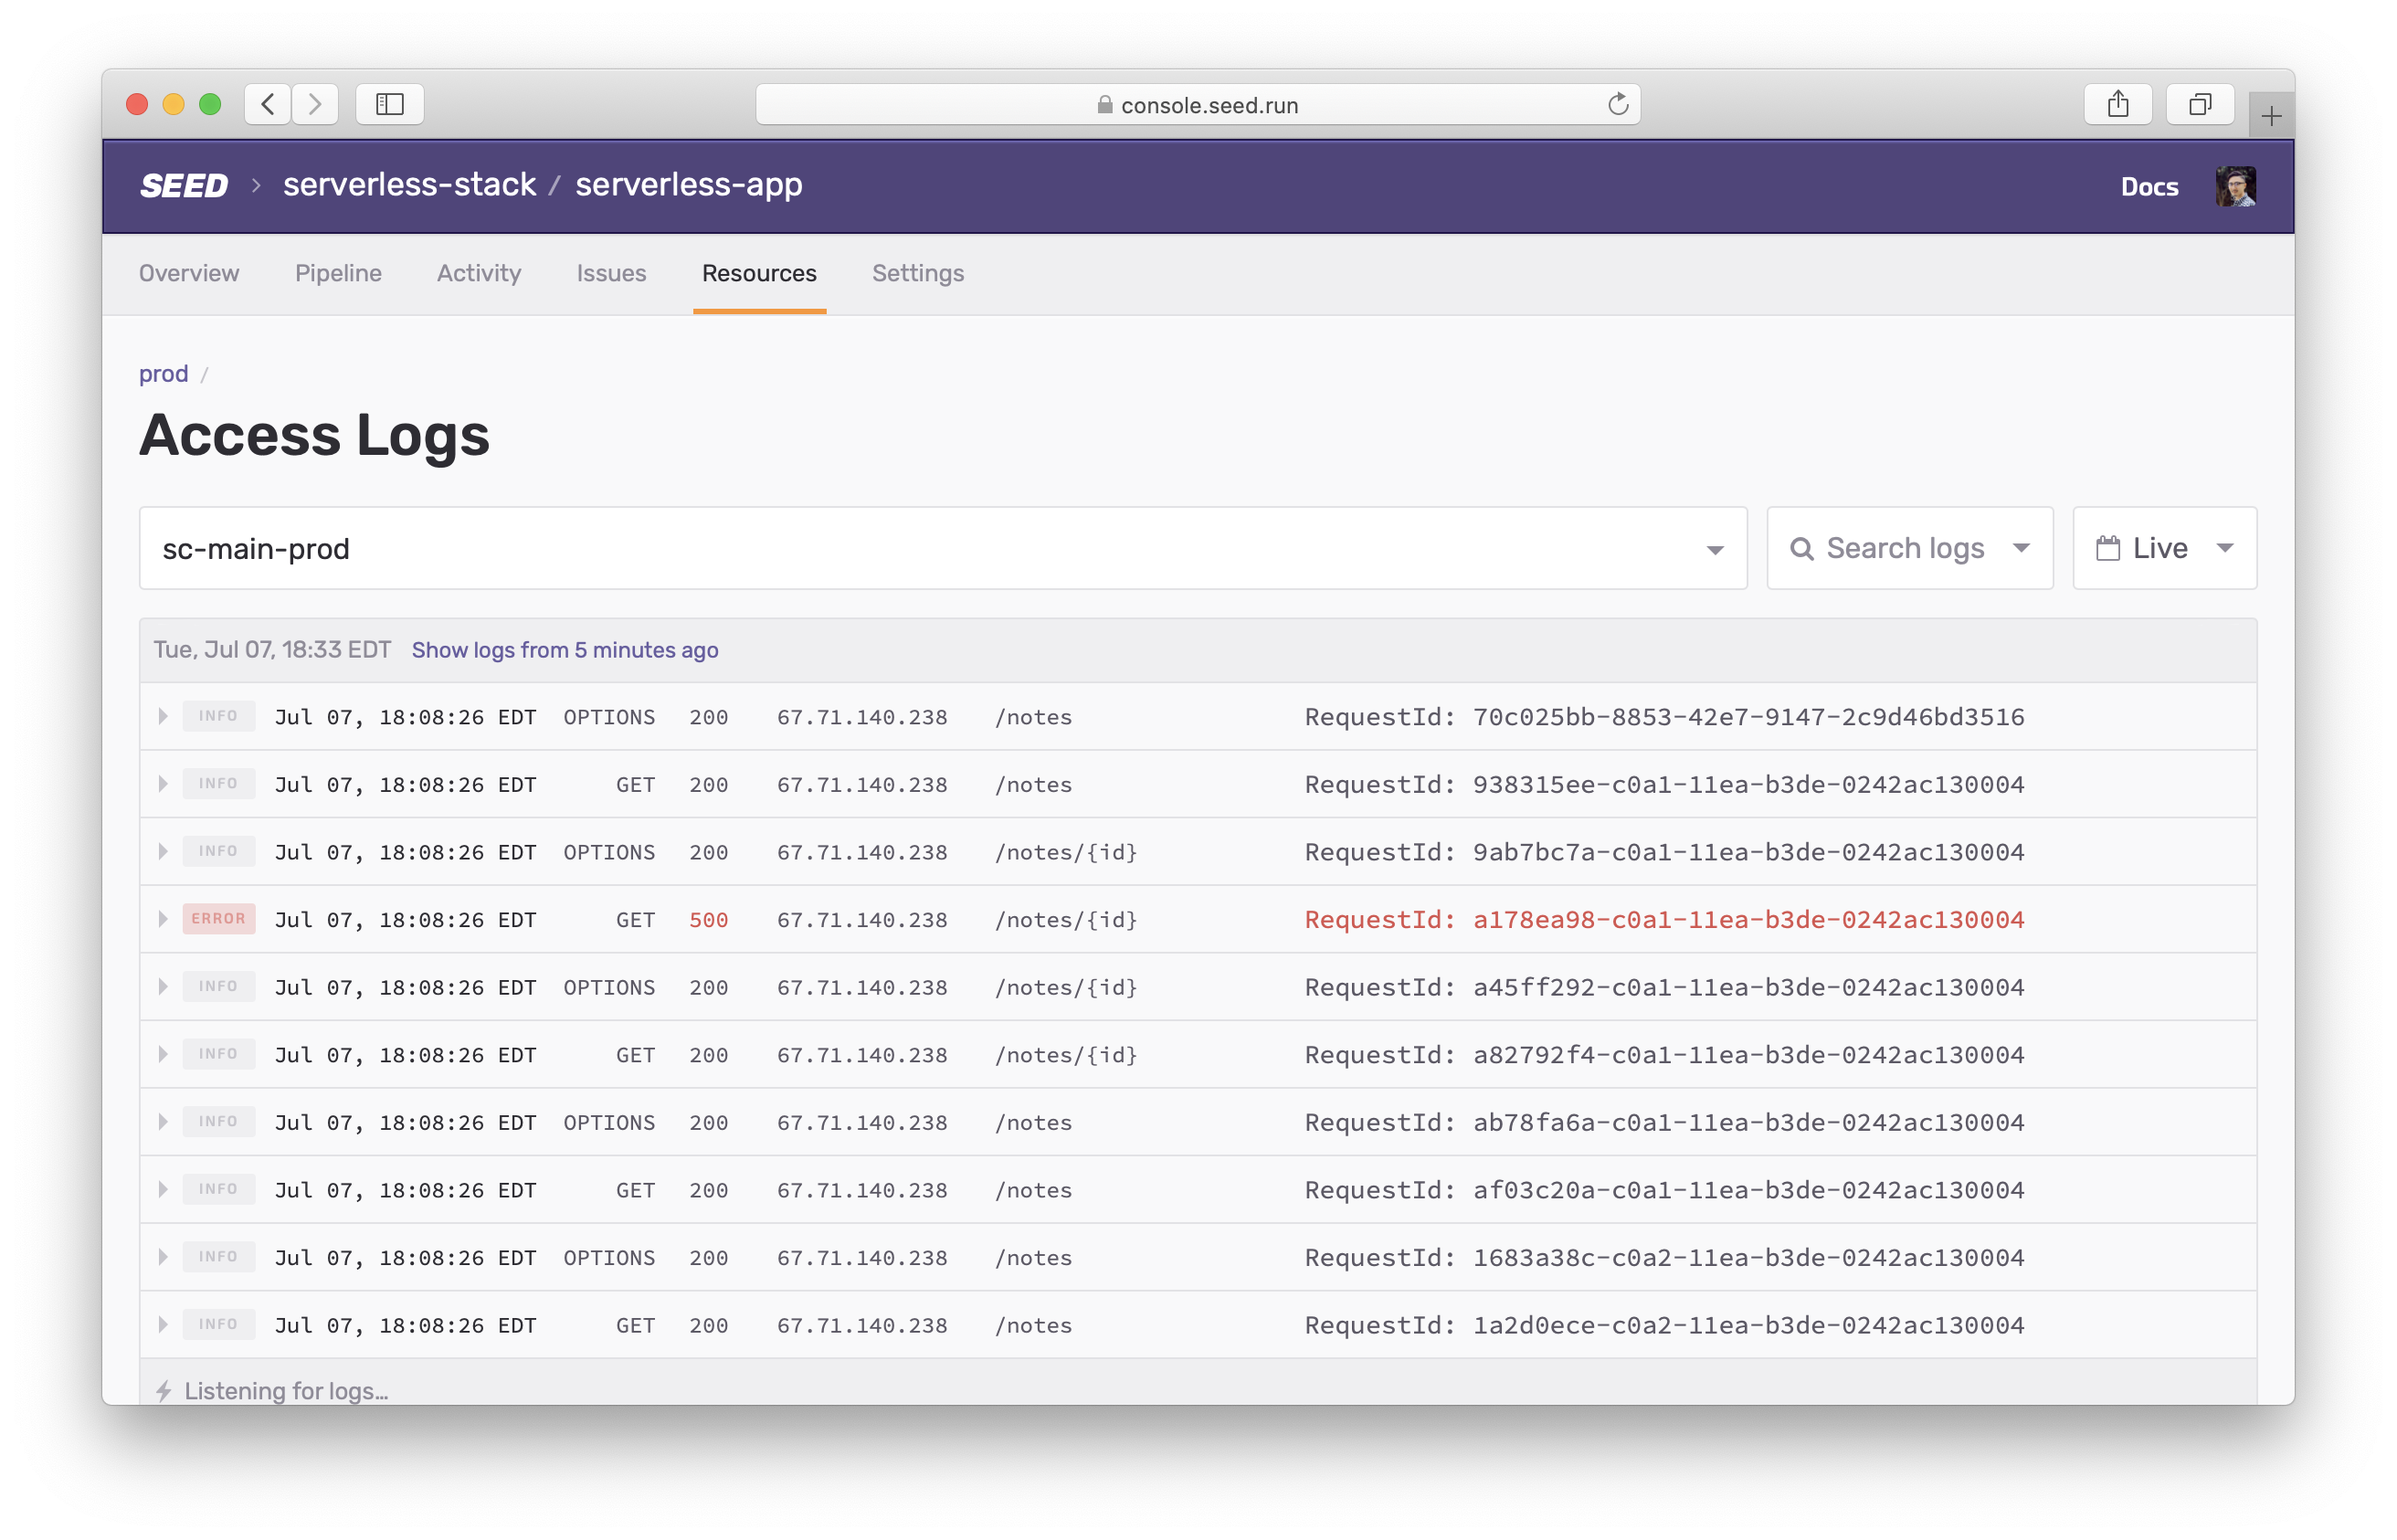
Note that, 4xx and 5xx status code responses are marked as errors.
Just like the Lambda functions, some logs might be skipped if you are viewing logs for a high traffic API endpoint. Additionally, some logs might appear slightly out of order.
Additional IAM Permissions
To connect to CloudWatch in your AWS account, Seed needs the following set of additional permissions.
{
  "PolicyName": "MonitorLogs",
    "PolicyDocument": {
      "Version": "2012-10-17",
      "Statement": [
        {
          "Effect": "Allow",
          "Action": [
            "logs:DescribeLogStreams",
          "logs:FilterLogEvents",
          "logs:StartQuery",
          "logs:StopQuery",
          "logs:GetQueryResults"
          ],
          "Resource": "*"
        }
      ]
    }
}
The log viewer in Seed is designed to work with your development workflow by helping you quickly debug any issues with your deployed apps.
Help improve this page. Edit it with GitHub
Was this page helpful? Let us know via Twitter
Do your Serverless deployments take too long? Incremental deploys in Seed can speed it up 100x!
Learn More